

G20: what did the leaders decide?
The G20 summit took place in Bali, Indonesia, on November 2022…

Don’t waste your time – keep track of how NFP affects the US dollar!
Data Collection Notice
We maintain a record of your data to run this website. By clicking the button, you agree to our Privacy Policy.

Beginner Forex Book
Your ultimate guide through the world of trading.

Check Your Inbox!
In our email, you will find the Forex 101 book. Just tap the button to get it!
Risk warning: CFDs are complex instruments and come with a high risk of losing money rapidly due to leverage.
66.43% of retail investor accounts lose money when trading CFDs with this provider.
You should consider whether you understand how CFDs work and whether you can afford to take the high risk of losing your money.
Warning! Old version of the browser!
Press one of the icons below to proceed to the official website of the developer and download the latest version of your browser.

Online Forex broker
Information is not investment advice
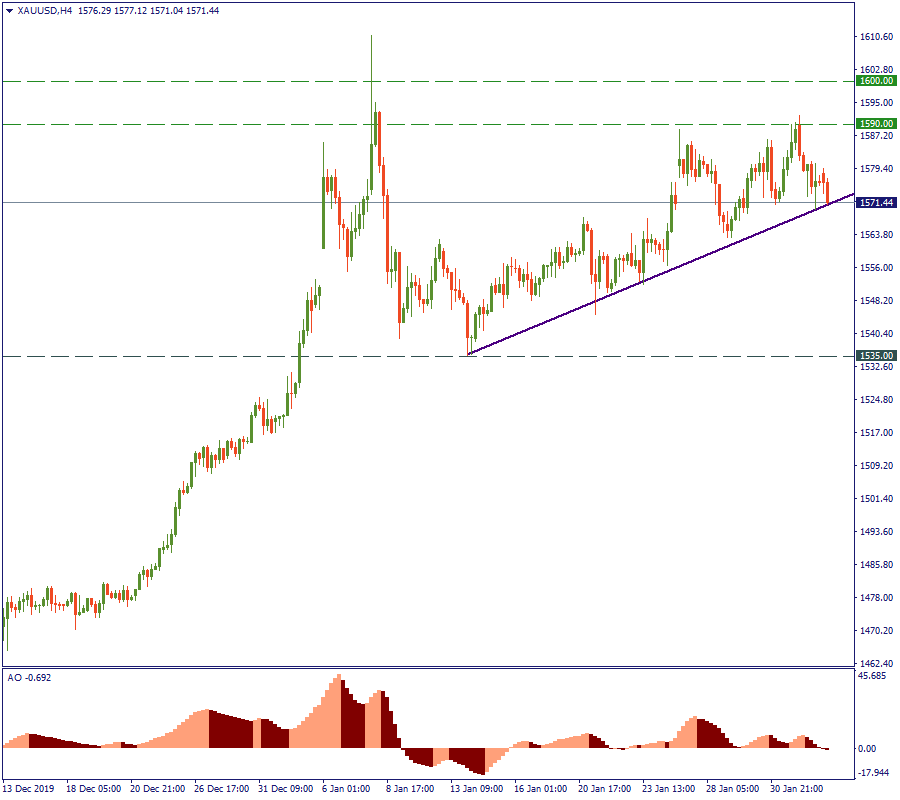
The H4 chart below shows how gold reacted to the virus. Rising from $1,535 to $1,590, it came to the level $10 away from its 6-years high. At the pace the virus is raging, or at least at the pace the efforts to suppress it are exacted, we may well see $1,600 at the end of this week. So from the mid-term perspective, you only need to follow the news reports and estimate how fast the virus is expected to be brought down to the comfortable zone of controllability. Most of the media report authorities advising against resuming normal business activities in China and related countries until next week. Therefore, plan your trades accordingly. The next checkpoint will be this weekend.
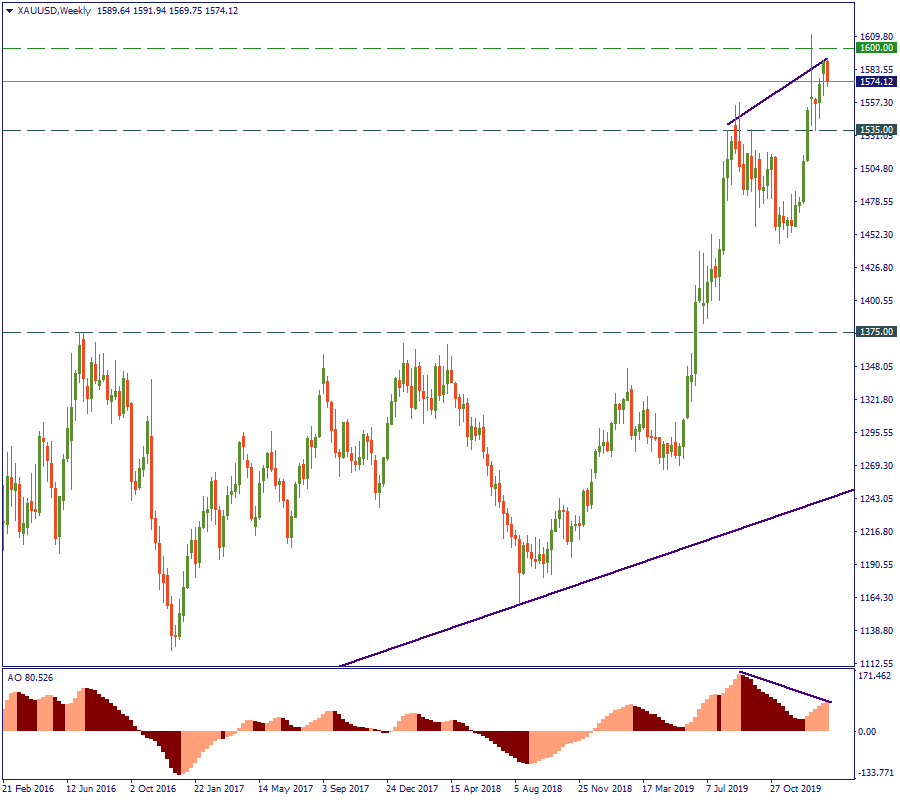
The almost unnoticeable line at the very end of the weekly chart of XAU/USD is the uptrend marked above. As you can see, there is little the Coronavirus changed on the grand scheme – at least, for now; at least, for gold. Even if nothing happened and the observers did not speak about hedging strategies, black swans and the Chinese failure to recuperate after the trade war because of this, still you would expect the price to keep rising. Also, you would not need the recent US-Iran week-long conflict escalation in the Middle East to expect the price to come to $1,600 eventually. At least, after gold broke the 6-years-resistance of $1,375, which was keeping it in the sideways movement since 2013. There is an interesting technical element, however: a regular bearish divergence, predicting a coming mid-term decline. That may be useful for you if you prefer to sell gold now and come back a month later to buy it at a lower price.
But if we rewind the tape before summer 2019 – meaning, if we place ourselves back into that period of the sideways movement with the imposing resistance of $1,375 – what would be our impression? Or what should it be?
The answer to this is: always look at the further horizon. So let’s see it.
The maximum observable depth for gold in MetaTrader is back to 1997. The monthly chart below crops the initial 5 years and starts with 2002, but it doesn’t change the picture much. The essence is, even removing the scary years of the global financial crisis 2008-2011, the trend seems to be unstoppably upward. Using the method of simple extrapolation (like any prediction-based scientific model would do), it is most likely to see another twenty years of rising price for gold. As fantastic as it seems right now, the cosmic all-time high of $1,900 appears pretty reachable from this perspective. If the pace and trend stay the same, we may well see that within 5 years.
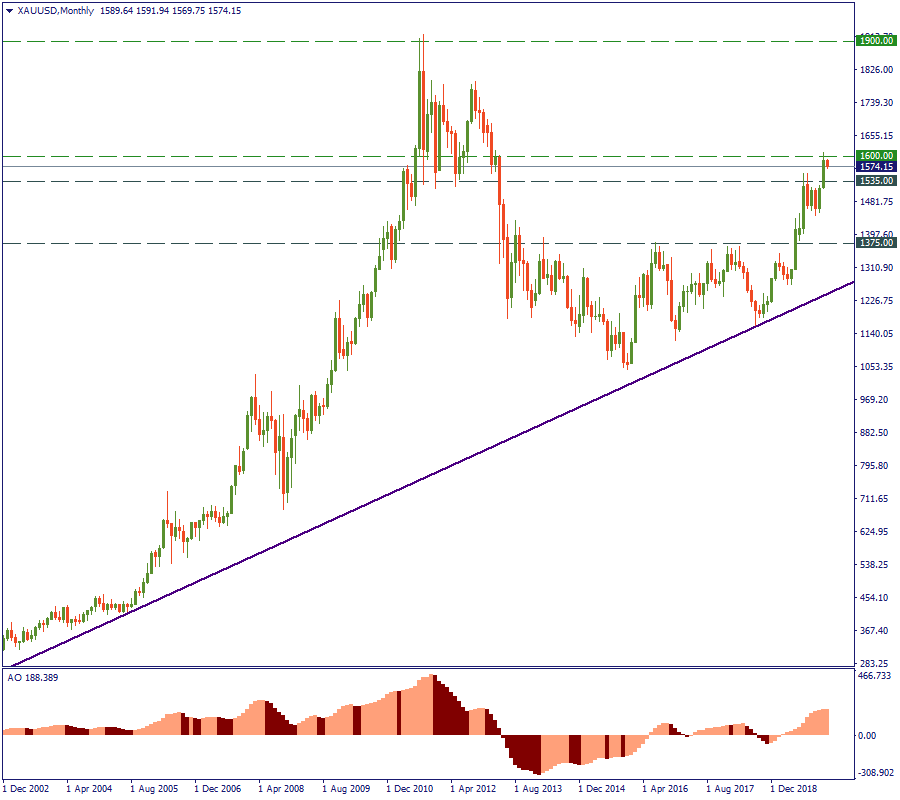
Trade gold. It’s worth it. At least, you will diversify. At most – you will be rich by 2025.
The G20 summit took place in Bali, Indonesia, on November 2022…

The deafening news shocked the whole world yesterday: the British Queen Elizabeth II died peacefully at the age of 96…
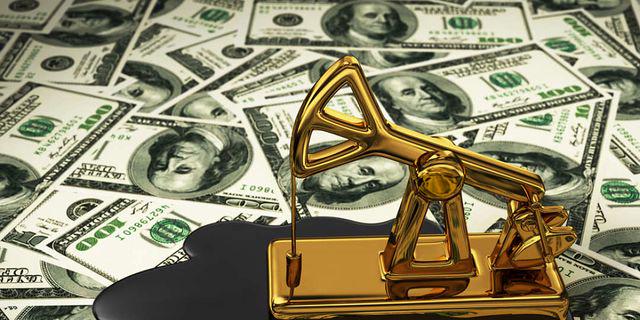
After months of pressure from the White House, Saudi Arabia relented and agreed with other OPEC+ members to increase production.

eurusd-is-falling-what-to-expect-from-the-future-price-movement

Greetings, fellow forex traders! Exciting news for those with an eye on the Australian market - the upcoming interest rate decision could be good news for Aussies looking to refinance or take out new loans. The Mortgage and Finance Association Australia CEO, Anja Pannek, has...

Hold onto your hats, folks! The Japanese yen took a nosedive after the Bank of Japan (BOJ) left its ultra-loose policy settings unchanged, including its closely watched yield curve control (YCC) policy. But wait, there's more! The BOJ also removed its forward guidance, which had previously pledged to keep interest rates at current or lower levels. So, what's the scoop? Market expectations had been subdued going into the meeting, but some were still hoping for tweaks to the forward guidance to prepare for an eventual exit from the bank's massive stimulus


Your request is accepted.
We will call you at the time interval that you chose
Next callback request for this phone number will be available in 00:30:00
If you have an urgent issue please contact us via
Live chat
Internal error. Please try again later