


Best Trade Ideas for April
I know we've had quite an amazing run these past few month, with over 78% accuracy in our trade ideas and sentiments, and thousands of pips in profits monthly...

Don’t waste your time – keep track of how NFP affects the US dollar!
Data Collection Notice
We maintain a record of your data to run this website. By clicking the button, you agree to our Privacy Policy.

Beginner Forex Book
Your ultimate guide through the world of trading.

Check Your Inbox!
In our email, you will find the Forex 101 book. Just tap the button to get it!
Risk warning: ᏟᖴᎠs are complex instruments and come with a high risk of losing money rapidly due to leverage.
70.72% of retail investor accounts lose money when trading ᏟᖴᎠs with this provider.
You should consider whether you understand how ᏟᖴᎠs work and whether you can afford to take the high risk of losing your money.
Warning! Old version of the browser!
Press one of the icons below to proceed to the official website of the developer and download the latest version of your browser.

Online Forex broker
Information is not investment advice
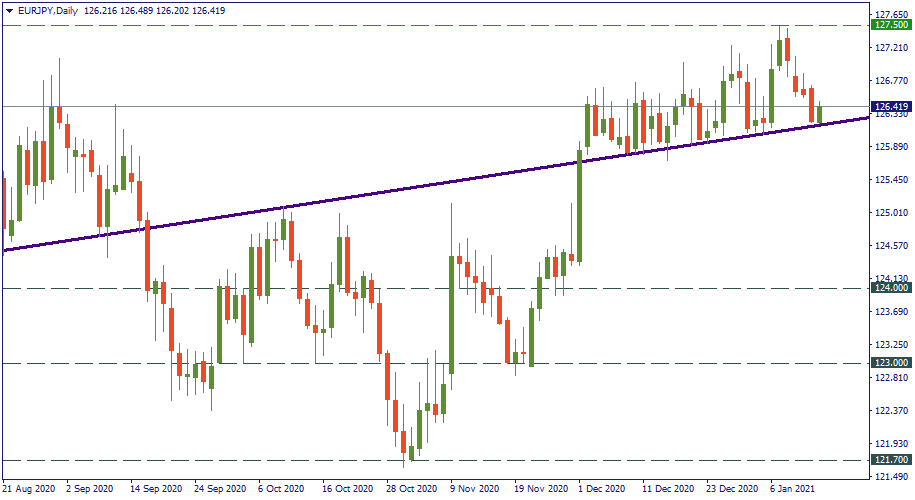
First, the trend line. How to draw trend lines is one of the most frequently asked questions. On the chart below it should be visibly obvious how to do that. See if you can find a sequence of highs or lows that seems to follow the same line – and draw that line. Here, we have such a sequence: all that comes after December 1 is well lined-up in a straight upward trajectory.
There is more: although it didn’t fit into the chart, but the side on the left – that comes before August 21 – also follows the same trend. How to explain that: possibly, assuming that the September-November set back was just a temporary correction of a larger upward trend. In any case, there is no denying that the ascending trajectory on the left and the same on the right follow exactly the same uptrend. That is why we have it over there.
How to use it? Extend the trend into the future. When does it supposedly come to, say, 127.50? In two-three months. Now, that’s your basis for long-term planning. It may be there earlier, or, it may fall behind that trajectory, but at least for position trading you already have a plan: the resistance of 127.50 to be reached in April.
What else do we have here? Several layers of support. 124.00, 123,00, and 121,80. The first two are probably even more valid as these are round levels. So, here is another F. A. Q.: “How to draw support and resistance levels”? Here you go: observe the stairs-like nature of the dropdown and its resolution that happened in September-November. During these months, the price doesn’t seem to have stopped at other levels but these three. This is your guide to find supports: if the price touched the same bottom several times, this is your support level. 123.00 is the most frequently visited line here. It was slightly broken in September, touched in October, and made the price reverse in November.
What use do you make of this one? For future references and preparations. If you see that the long-term picture point to the downside – you’ll know that 123.00 may be one of the key targets for the price. IF and when it comes down there, it will be having the strongest potential to send the price back up as it did already several times.
So, that was your practical briefing on how to set trend lines and support levels. Thank EUR/JPY.

I know we've had quite an amazing run these past few month, with over 78% accuracy in our trade ideas and sentiments, and thousands of pips in profits monthly...

Futures for Canada's main stock index rose on Monday, following positive global markets and gains in crude oil prices. First Citizens BancShares Inc's announcement of purchasing the loans and deposits of failed Silicon Valley Bank also boosted investor confidence in the global financial system...

Investor confidence in the global financial system has been shaken by the collapse of Silicon Valley Bank and Credit Suisse. As a result, many are turning to bearer assets, such as gold and bitcoin, to store value outside of the system without...

eurusd-is-falling-what-to-expect-from-the-future-price-movement

Greetings, fellow forex traders! Exciting news for those with an eye on the Australian market - the upcoming interest rate decision could be good news for Aussies looking to refinance or take out new loans. The Mortgage and Finance Association Australia CEO, Anja Pannek, has...

Hold onto your hats, folks! The Japanese yen took a nosedive after the Bank of Japan (BOJ) left its ultra-loose policy settings unchanged, including its closely watched yield curve control (YCC) policy. But wait, there's more! The BOJ also removed its forward guidance, which had previously pledged to keep interest rates at current or lower levels. So, what's the scoop? Market expectations had been subdued going into the meeting, but some were still hoping for tweaks to the forward guidance to prepare for an eventual exit from the bank's massive stimulus


Your request is accepted.
We will call you at the time interval that you chose
Next callback request for this phone number will be available in 00:30:00
If you have an urgent issue please contact us via
Live chat
Internal error. Please try again later