


Williams’ Strategy
Bill Williams is the creator of some of the most popular market indicators: Awesome Oscillator, Fractals, Alligator, and Gator.

Don’t waste your time – keep track of how NFP affects the US dollar!
Data Collection Notice
We maintain a record of your data to run this website. By clicking the button, you agree to our Privacy Policy.

Join Us on Facebook
Stay on top of company updates, trading news, and so much more!
Thanks, I already follow your page!
Beginner Forex Book
Your ultimate guide through the world of trading.

Check Your Inbox!
In our email, you will find the Forex 101 book. Just tap the button to get it!
Risk warning: ᏟᖴᎠs are complex instruments and come with a high risk of losing money rapidly due to leverage.
69.21% of retail investor accounts lose money when trading ᏟᖴᎠs with this provider.
You should consider whether you understand how ᏟᖴᎠs work and whether you can afford to take the high risk of losing your money.
Warning! Old version of the browser!
Press one of the icons below to proceed to the official website of the developer and download the latest version of your browser.

Online Forex broker
Information is not investment advice
The universe works in cycles. Time works in cycles. Our planet works in cycles. Climate, biosphere, human development, political tensions, wars, your daily coffee – everything is set in motion in cycles. But make no mistake: nature doesn’t like replicas. So by cycles, we don’t mean a repetition of the same thing over and over again – regardless of the context. Rather, we mean that all things develop in stages. Including the stock market. How can you use it in your trade? Know how to recognize a coming shift to the next stage, make your bet, and win.
At the first sight, there are no cycles or stages in the recovery of the S&P. Just a straight, linear uptrend distorted by volatility like a weak radio-wave transmission. That’s one way to see it. Look closer.
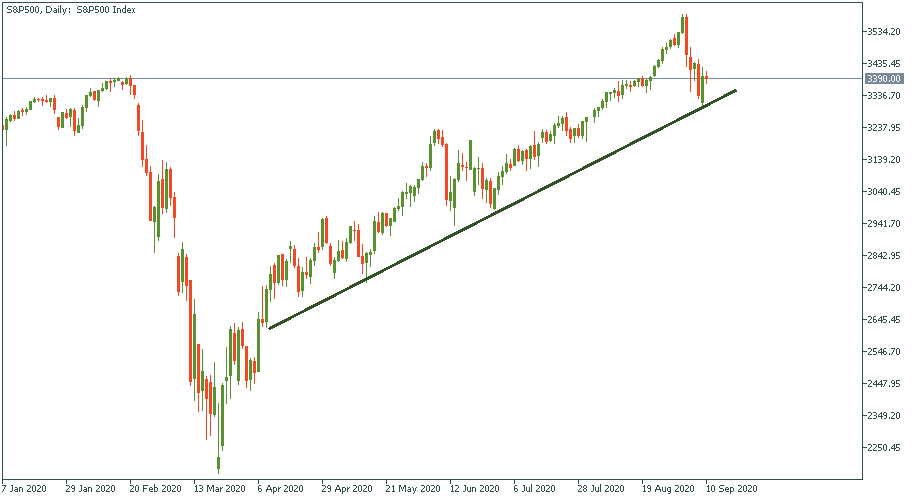
After examining the chart further, you will see that the path of the S&P’s recovery is somewhat binary, like a sequence of 0-1-0-1-0-1. After a clear rise, there is a period of contraction notable for lower highs and flat-firm support. There have been already three such sections, and it seems we are entering the fourth one. If it is true, then we will see intensified volatility within which there will be one of two highs lower than the last one, an overall sideways move across the support, and then another rise.
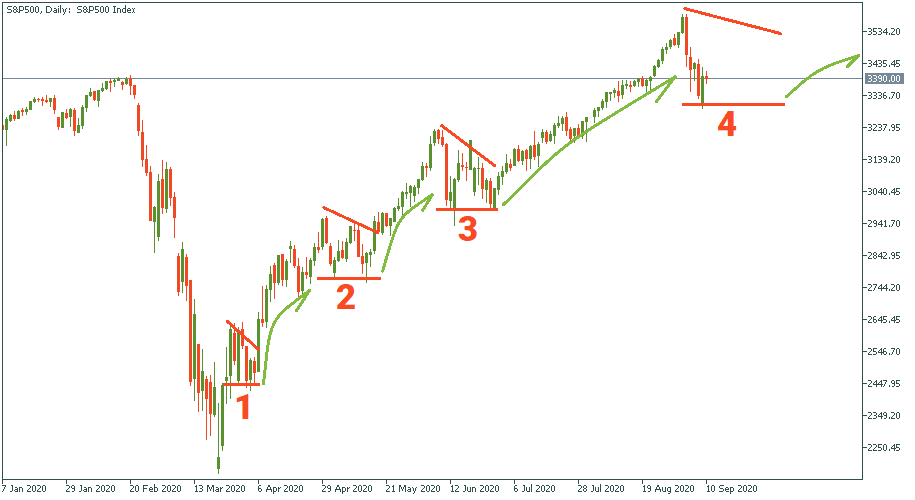
But is it certain that we will see such a period of volatility and lower highs before the S&P goes upwards again? No. We are in the process of verifying it right now, and it will take time. That’s why cycles here are not understood as identical periods when the chart repeats its formation evenly distributed across the timeline. Rather, we have an apparent pattern of contraction-expansion duality that unfolds in the S&P as the time goes by. The key is: we don’t take time as the basis for identifying which section we are in. Time is irrelevant. Instead, we identify it by comparing the logic of the movements to the previous periods. “But maybe that’s only applicable to the recovery!”. That may be – let’s check our duality hypothesis with a more strategic look at the S&P chart.
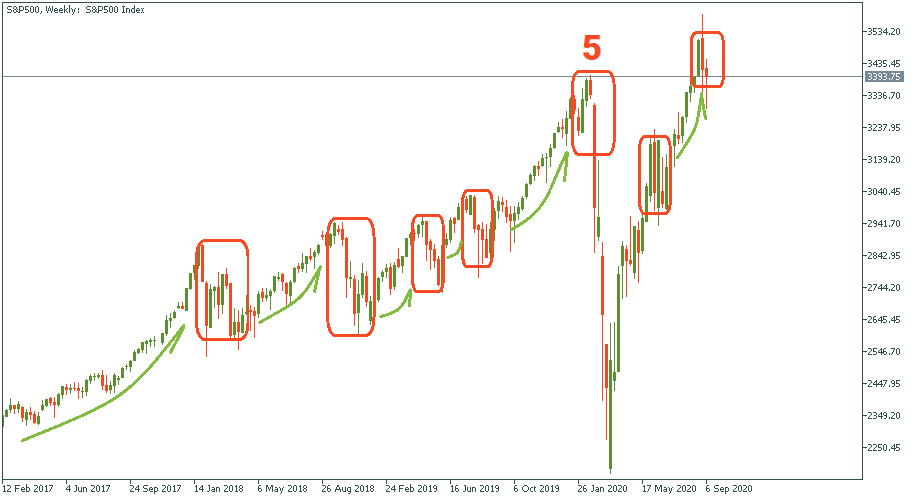
The last three years saw pretty much the same landscape of the S&P: an overall steady uptrend that sees alternating drops and rises. It is interesting to note that the fifth period where the crisis hit logically would see a drop anyways – it was “due” because the rising that preceded it was already long and high enough. From this point of view, the crisis immensely intensified the drop but did not force it onto the chart – it had to happen anyway. “But if the time and span of each period is different, how do we know what comes when?”. A fair question. First, although the span of drops and leaps vary, their length and smoothness revolves around average. That means, one rise takes two months, another one takes two, another one six, another maybe even a year, but there will be an average period during which the S&P normally follows a smooth uptrend before bumping into volatility and contraction. In the chart below, we see that the first arrow under the uptrend is almost one year long – from Feb 2017 to the end of 2017. But it is only one out of multiple such periods, and it is the only one that long. The rest are comparable in duration.
How do you use it: on your observed timeframe, measure all the spans of periods of rising, calculate the weighted average, and keep it in mind. The more the current uptrend deviates from this average, the more the probability is that it will end soon.
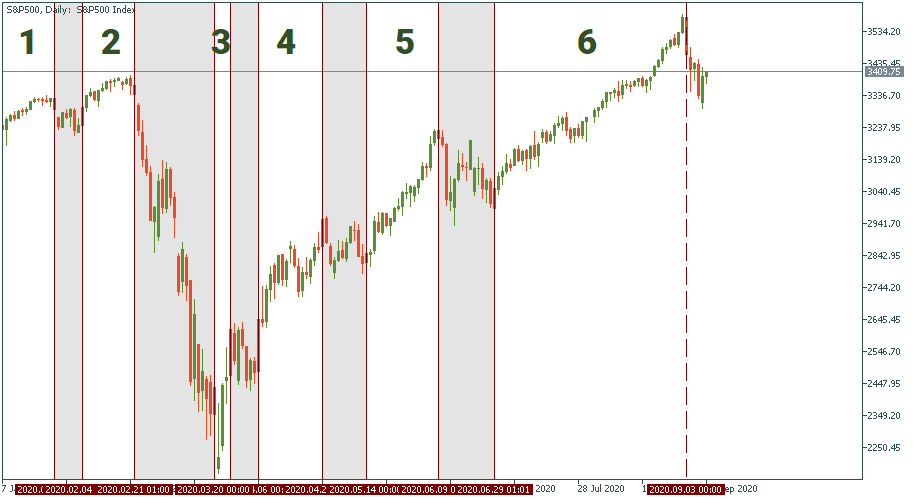
In the daily chart below, you have alternating periods of growth and decline by the S&P. Even visually, you can see that periods 1, 2, 4, 5 are pretty much similar in span. While periods 3 and 6 are definitely out of order: period 3 is way too short, and period 6 is way too long. How to calculate the weighted moving average based on these observations?
Let’s round up and assume that periods 1, 2, 4, and 5 had the same span. How much was it? 15 bars on average. So 4 period by 15 bars. Then we have one oddly short period spanning 3 bars and one extremely large period lasting 48 bars. Now, the math: 4*15 + 1*3 + 1*48 / (4+1+1) = 18.5. We can make it round to 18. So the weighted average length of a period of rising of the S&P in our chart is 18 bars.
How do we use this knowledge? After the current downfall, there will be another period of rising. Expect it to be more or less 18-bar long. If and once it extends beyond that – expected that a new downfall is imminent. And prepare.

Bill Williams is the creator of some of the most popular market indicators: Awesome Oscillator, Fractals, Alligator, and Gator.

Trend strategies are good - they may give significantly good results in any time frame and with any assets. The main idea of the ADX Trend-Based strategy is to try to catch the beginning of the trend.

Counter-trend strategies are always the most dangerous but also the most profitable. We are pleased to present an excellent counter-trend strategy for working in any market and with any assets.

eurusd-is-falling-what-to-expect-from-the-future-price-movement

Greetings, fellow forex traders! Exciting news for those with an eye on the Australian market - the upcoming interest rate decision could be good news for Aussies looking to refinance or take out new loans. The Mortgage and Finance Association Australia CEO, Anja Pannek, has...

Hold onto your hats, folks! The Japanese yen took a nosedive after the Bank of Japan (BOJ) left its ultra-loose policy settings unchanged, including its closely watched yield curve control (YCC) policy. But wait, there's more! The BOJ also removed its forward guidance, which had previously pledged to keep interest rates at current or lower levels. So, what's the scoop? Market expectations had been subdued going into the meeting, but some were still hoping for tweaks to the forward guidance to prepare for an eventual exit from the bank's massive stimulus


Your request is accepted.
We will call you at the time interval that you chose
Next callback request for this phone number will be available in 00:30:00
If you have an urgent issue please contact us via
Live chat
Internal error. Please try again later