

Best Trade Ideas for April
I know we've had quite an amazing run these past few month, with over 78% accuracy in our trade ideas and sentiments, and thousands of pips in profits monthly...

Don’t waste your time – keep track of how NFP affects the US dollar!
Data Collection Notice
We maintain a record of your data to run this website. By clicking the button, you agree to our Privacy Policy.

Join Us on Facebook
Stay on top of company updates, trading news, and so much more!
Thanks, I already follow your page!
Beginner Forex Book
Your ultimate guide through the world of trading.

Check Your Inbox!
In our email, you will find the Forex 101 book. Just tap the button to get it!
Risk warning: ᏟᖴᎠs are complex instruments and come with a high risk of losing money rapidly due to leverage.
69.21% of retail investor accounts lose money when trading ᏟᖴᎠs with this provider.
You should consider whether you understand how ᏟᖴᎠs work and whether you can afford to take the high risk of losing your money.
Warning! Old version of the browser!
Press one of the icons below to proceed to the official website of the developer and download the latest version of your browser.

Online Forex broker
Information is not investment advice
In this article, we will discuss US100, US500, HK50.
China's coronavirus cases have hit a seven-month high after a cluster at a testing site drove up case numbers as the Delta variant challenges the nation's grip on the pandemic.
Only Chinese vaccines are currently being given in China, and authorities say more than 1.6 billion doses have been administered. However, experts are concerned that these vaccines are not effective. Current outbreaks across China, while still in the hundreds of cases in total, have spread much more widely than previous ones. Many cases have been identified as the highly contagious Delta variant.
COVID-19 problem coupled with a regulatory crackdown on sectors including technology and after-school tutoring dumped investors’ sentiment towards Chinese stocks. That’s why HK50 is getting pressured.
H4 HK50 chart
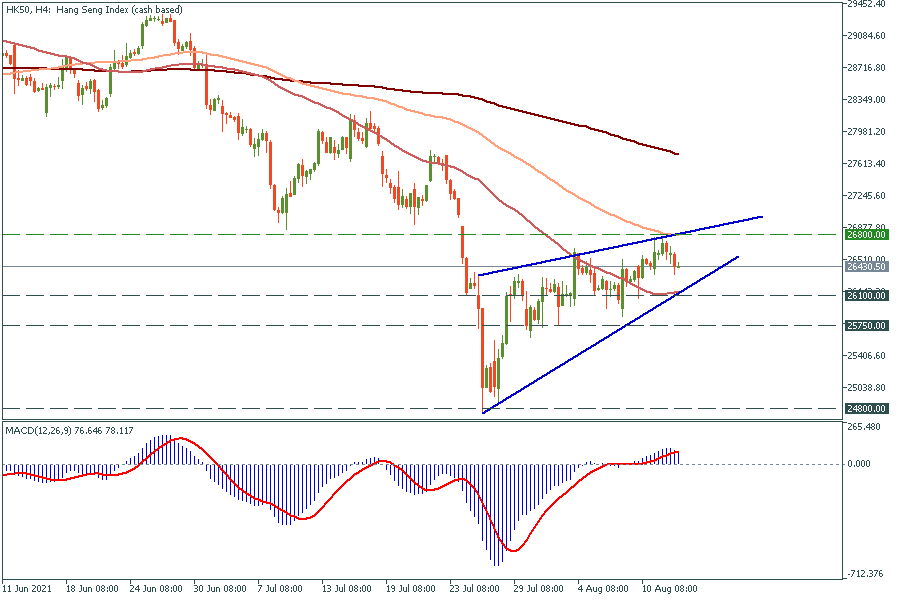
On the 4 hours chart, the HK 50 has formed the rising wedge, which is the bearish pattern. At the moment, HK50 is heading towards the 50-period moving average, which is also the bottom line of the wedge. If the index breaks through this support, it might drop down to 25750 and 24800 support levels. Otherwise, it might test the top line of the pattern at 26800 once again.
NASDAQ (US100)
During recent months, US100 has been demonstrating a correlation with the US dollar index. This is happening as investors believe that the US dollar weakening might force the government to raise the interest rate. When it happens, investors prefer to get rid of risky assets.
Also, many countries have already removed COVID-19 restrictions and people spend less time using their computers. This will negatively affect US100, as it consists of the 100 largest IT companies.
US100 Daily chart
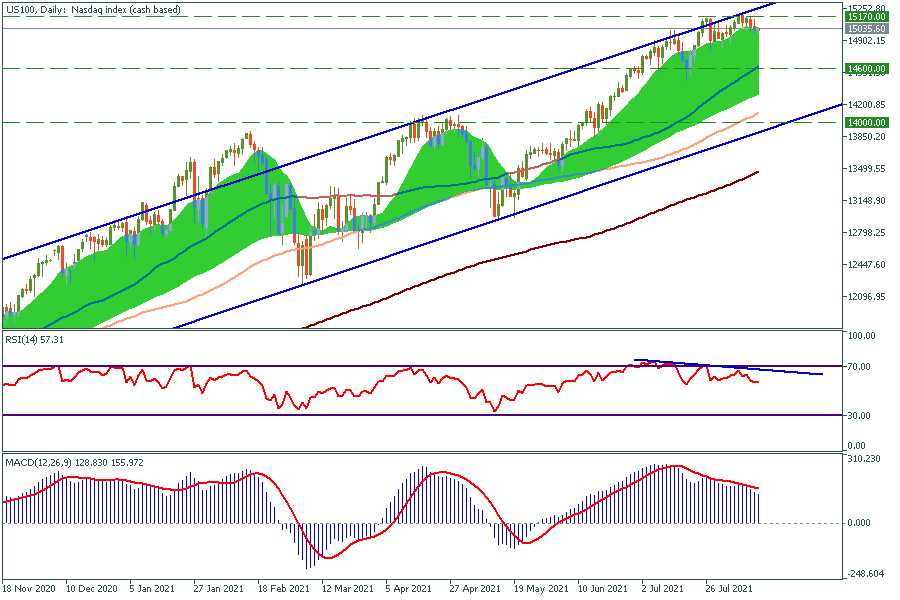
On the daily chart, it is noticeable that US100 is moving inside the rising channel. At the moment, we can see bearish divergence with the RSI. The MACD oscillator also shows that the trend is getting weaker. MA Ribbon indicates that the trend gained maximum momentum and as it is seen on the chart, it is a signal for upcoming correction. We expect US100 to fall to 14000 to the bottom line of the channel.
S&P 500 (US500)
US 500 index consists of 500 largest US companies. Investors took into account a report pointing to contained inflationary pressures and considered the likelihood of more government spending on infrastructure. That pushes the main US economy index to new heights.
US500 Daily Chart
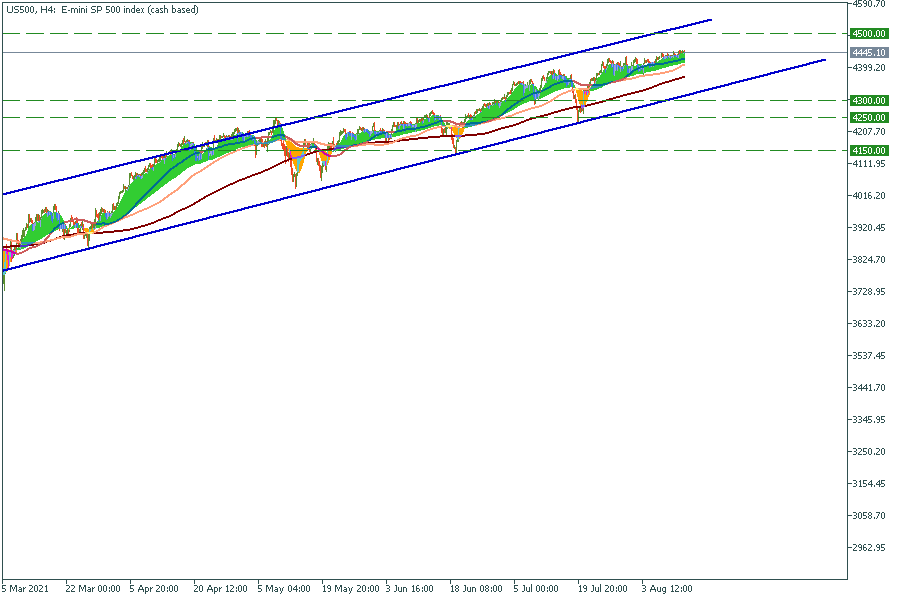
Despite positive factors for the US economy, the US 500 index cannot reach the upper border of the channel. It means the trend is getting weaker. MA Ribbon indicator also shows that the momentum decreases since May 2021. If US500 breaks through the 100-period moving average, it will drop to the lower border of the channel, which is 4300. We suggest opening S&P500 as soon as it reaches either border of the channel.
Resistance levels: 4500
Support levels: 4300, 4250, 4150
I know we've had quite an amazing run these past few month, with over 78% accuracy in our trade ideas and sentiments, and thousands of pips in profits monthly...

Futures for Canada's main stock index rose on Monday, following positive global markets and gains in crude oil prices. First Citizens BancShares Inc's announcement of purchasing the loans and deposits of failed Silicon Valley Bank also boosted investor confidence in the global financial system...

Investor confidence in the global financial system has been shaken by the collapse of Silicon Valley Bank and Credit Suisse. As a result, many are turning to bearer assets, such as gold and bitcoin, to store value outside of the system without...

eurusd-is-falling-what-to-expect-from-the-future-price-movement

Greetings, fellow forex traders! Exciting news for those with an eye on the Australian market - the upcoming interest rate decision could be good news for Aussies looking to refinance or take out new loans. The Mortgage and Finance Association Australia CEO, Anja Pannek, has...

Hold onto your hats, folks! The Japanese yen took a nosedive after the Bank of Japan (BOJ) left its ultra-loose policy settings unchanged, including its closely watched yield curve control (YCC) policy. But wait, there's more! The BOJ also removed its forward guidance, which had previously pledged to keep interest rates at current or lower levels. So, what's the scoop? Market expectations had been subdued going into the meeting, but some were still hoping for tweaks to the forward guidance to prepare for an eventual exit from the bank's massive stimulus


Your request is accepted.
We will call you at the time interval that you chose
Next callback request for this phone number will be available in 00:30:00
If you have an urgent issue please contact us via
Live chat
Internal error. Please try again later