

Best Trade Ideas for April
I know we've had quite an amazing run these past few month, with over 78% accuracy in our trade ideas and sentiments, and thousands of pips in profits monthly...

Don’t waste your time – keep track of how NFP affects the US dollar!
Data Collection Notice
We maintain a record of your data to run this website. By clicking the button, you agree to our Privacy Policy.

Join Us on Facebook
Stay on top of company updates, trading news, and so much more!
Thanks, I already follow your page!
Beginner Forex Book
Your ultimate guide through the world of trading.

Check Your Inbox!
In our email, you will find the Forex 101 book. Just tap the button to get it!
Risk warning: ᏟᖴᎠs are complex instruments and come with a high risk of losing money rapidly due to leverage.
69.21% of retail investor accounts lose money when trading ᏟᖴᎠs with this provider.
You should consider whether you understand how ᏟᖴᎠs work and whether you can afford to take the high risk of losing your money.
Warning! Old version of the browser!
Press one of the icons below to proceed to the official website of the developer and download the latest version of your browser.

Online Forex broker
Information is not investment advice
What happened?
Bitcoin became an official currency in Salvador. The Bitcoin Law (Spanish: Ley Bitcoin) was passed by the Legislative Assembly of El Salvador on 8 June 2021, giving the cryptocurrency bitcoin the status of legal tender within El Salvador after 7 September 2021.
El Salvador bought its first 400 bitcoins on Monday, which was equal to $20 million. President Nayib Bukele pledged to buy "a lot more" ahead of adopting the cryptocurrency as legal tender.
Members of the highly famous Reddit forum called for a $30 worth of Bitcoin purchase to support Salvador’s president's decision.
But as the famous proverb says: “buy the rumors, sell the news”. Bitcoin dropped from $52 000 to $43 000 in three hours and many positions got liquidated.
Technical analyses
In this article we will look at the Bitcoin logarithmic and Bitcoin domination charts, discuss the Bitcoin rainbow theory and look at the usual chart to predict an upcoming price movement.
The first thing you need to do to become a successful trader is to defy the market trend. Let’s start with it!
Bitcoin logarithmic monthly chart
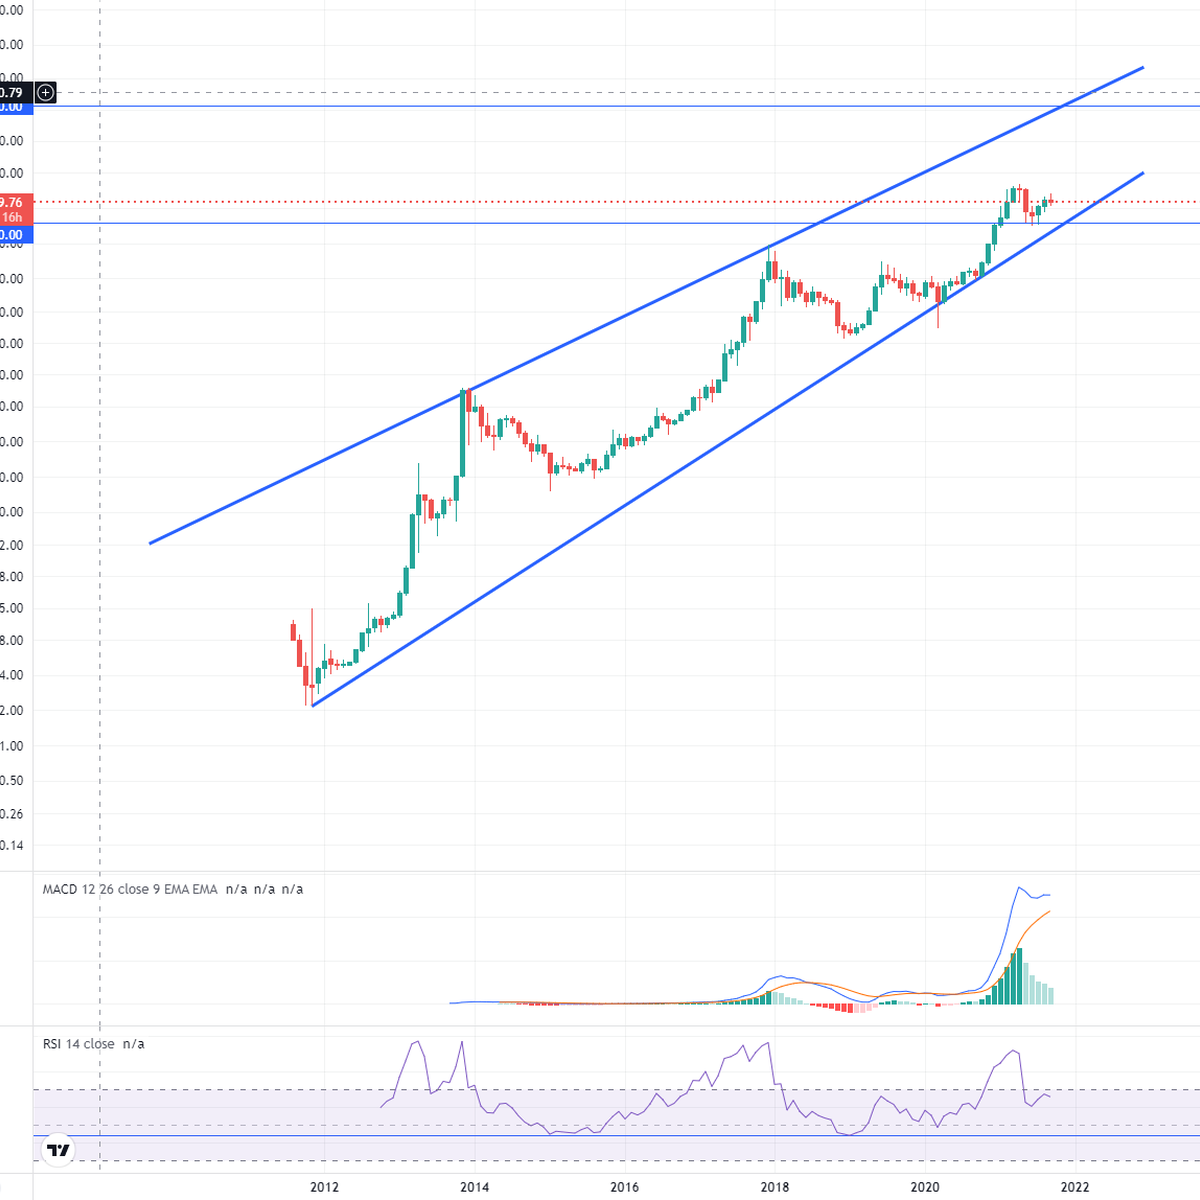
Bitcoin logarithmic chart is used by crypto traders to defy a potential trade reversal. As you can see, the RSI oscillator didn’t return to its normal meaning (which is 44) and the MACD indicator shows the potential trend reversal. These facts tell us that the correction is not over, and Bitcoin might return to the bottom line of the channel, which is $30 000. If crypto-asset bounces back from this level a “double bottom” pattern will be drawn, and the massive bull run will begin.
Bitcoin dominance monthly chart
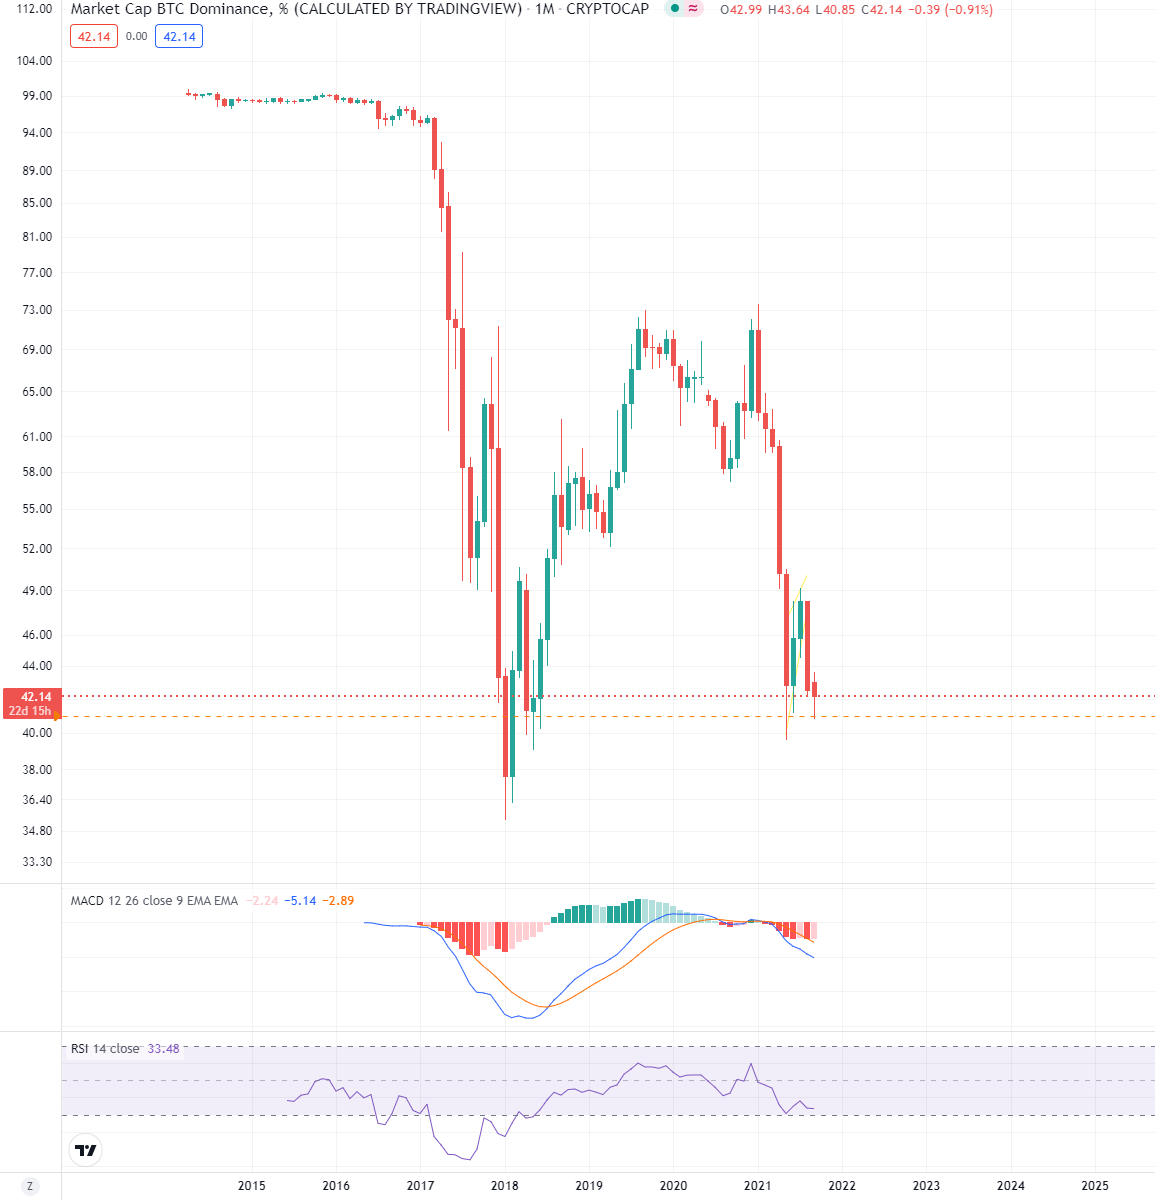
The dominance chart presents the Bitcoin attitude with all other cryptocurrencies. It is very useful for” alt-coin” season prediction. If the price goes down, altcoins are growing faster than the main crypto asset. Otherwise, when the price rises Bitcoin drops slower than altcoins do.
According to the chart, we can see that it reached the bottom and trying to reverse. As mentioned above it means that in the mid-term Bitcoin might fall and altcoins season is over.
Bitcoin rainbow theory chart
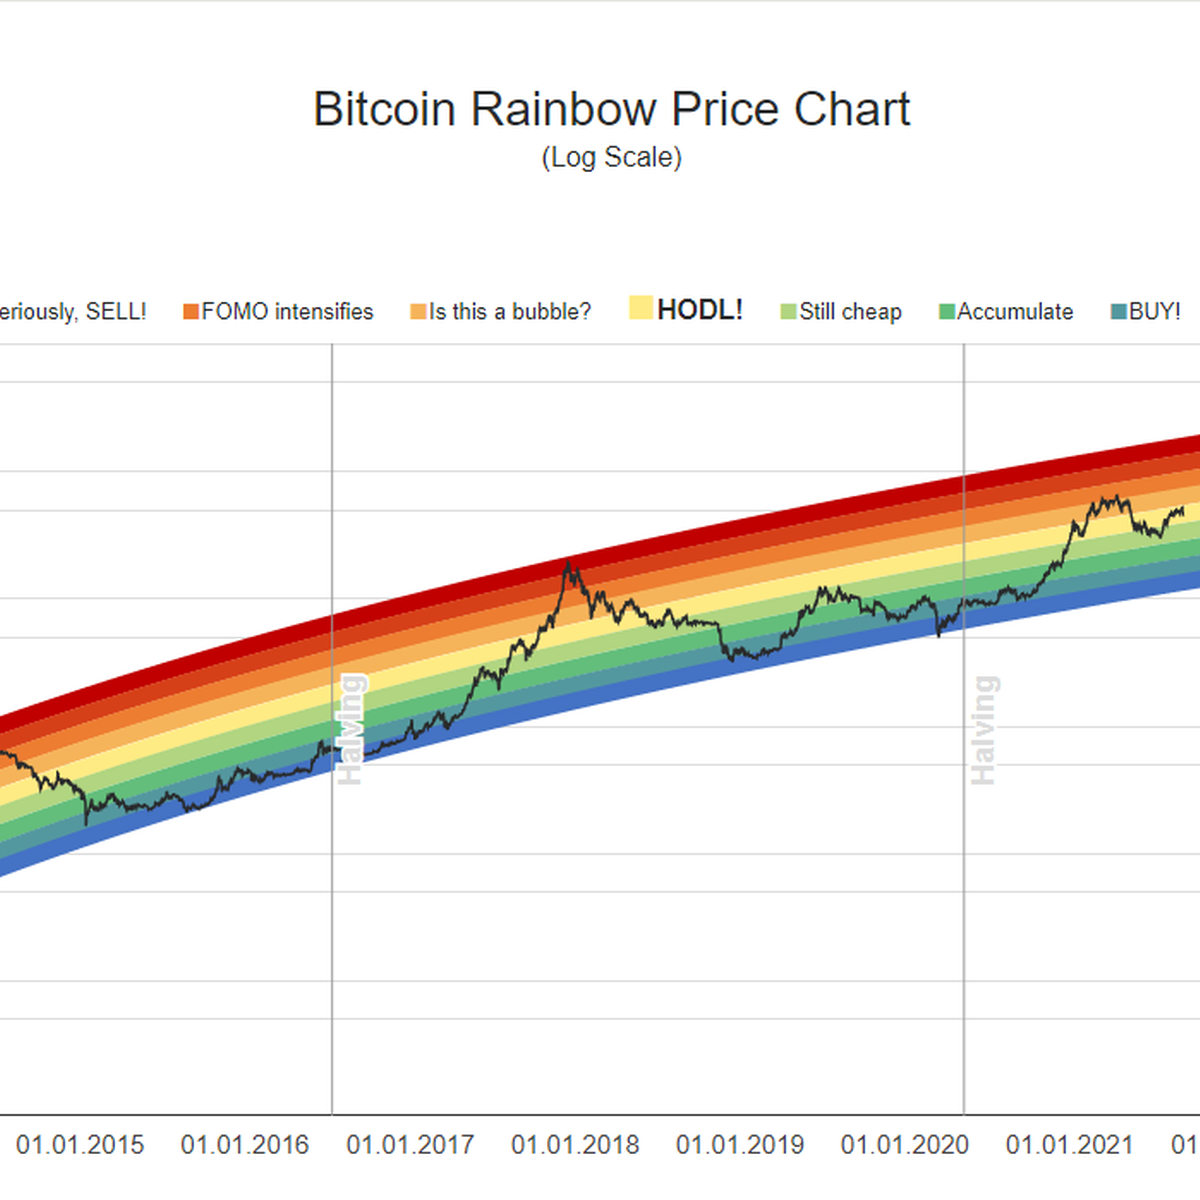
According to this chart after every halving Bitcoin reaches the upper (red) line of the rainbow. It didn’t reach this range after the last halving, so traders expect it to happen. The target varies from $150 000 to $200 000 depending on what time it will reach the red color.
Bitcoin Daily chart
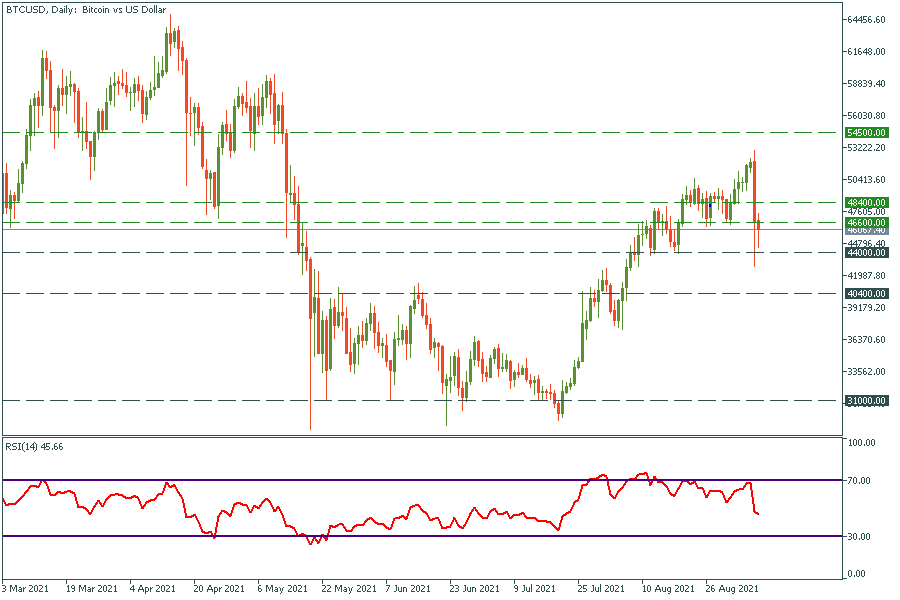
As we can see on Bitcoin's daily chart the price and the RSI round off, which is a bad sign. Although, we can notice that buyers activated, and they are trying to push the price above the $46 600 level. If they will make it by the end of September 8, we might see a tiny pull back up to the $48 500 - $49 000 range. If the Bitcoin price doesn’t renew the local high at $52 000 and returns to the $46 600 price level, the breakout of this level will set the targets at $40 400 and $31 000.
Bitcoin 1H chart
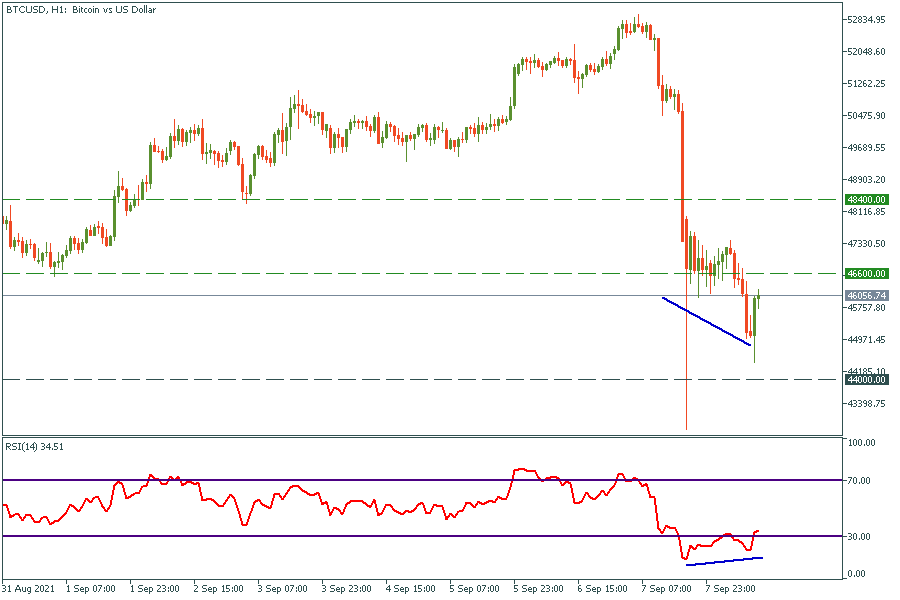
Bitcoin price has a divergence with the RSI on the 1H chart. The price might pull back to the $46 600 level and if it breaks through it might reach the $48 400 - $49 000 range.
Conclusion.
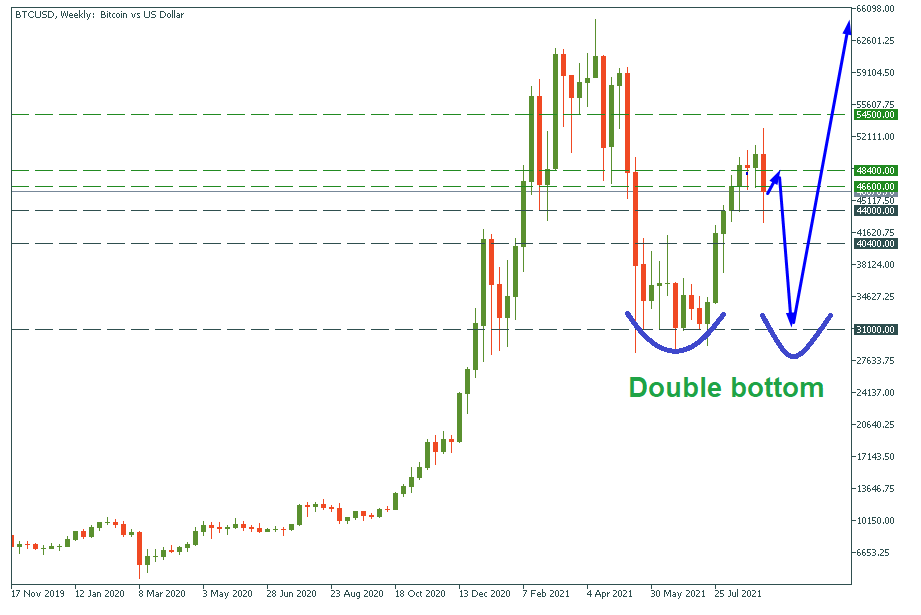
We expect Bitcoin to pull back up to $49 000 and drop down after back to $30 000 - $35 000, where it will draw a reversal pattern (it might be a double bottom pattern) and surge to the all-time high at $150 000 after.
Bitcoin weekly chart

I know we've had quite an amazing run these past few month, with over 78% accuracy in our trade ideas and sentiments, and thousands of pips in profits monthly...

Futures for Canada's main stock index rose on Monday, following positive global markets and gains in crude oil prices. First Citizens BancShares Inc's announcement of purchasing the loans and deposits of failed Silicon Valley Bank also boosted investor confidence in the global financial system...
Investor confidence in the global financial system has been shaken by the collapse of Silicon Valley Bank and Credit Suisse. As a result, many are turning to bearer assets, such as gold and bitcoin, to store value outside of the system without...

eurusd-is-falling-what-to-expect-from-the-future-price-movement

Greetings, fellow forex traders! Exciting news for those with an eye on the Australian market - the upcoming interest rate decision could be good news for Aussies looking to refinance or take out new loans. The Mortgage and Finance Association Australia CEO, Anja Pannek, has...

Hold onto your hats, folks! The Japanese yen took a nosedive after the Bank of Japan (BOJ) left its ultra-loose policy settings unchanged, including its closely watched yield curve control (YCC) policy. But wait, there's more! The BOJ also removed its forward guidance, which had previously pledged to keep interest rates at current or lower levels. So, what's the scoop? Market expectations had been subdued going into the meeting, but some were still hoping for tweaks to the forward guidance to prepare for an eventual exit from the bank's massive stimulus


Your request is accepted.
We will call you at the time interval that you chose
Next callback request for this phone number will be available in 00:30:00
If you have an urgent issue please contact us via
Live chat
Internal error. Please try again later