

Technical outlook and ideas for Forex pairs
We have outlooked several promising Forex pairs and the result can surprise you!

Don’t waste your time – keep track of how NFP affects the US dollar!
Data Collection Notice
We maintain a record of your data to run this website. By clicking the button, you agree to our Privacy Policy.

Beginner Forex Book
Your ultimate guide through the world of trading.

Check Your Inbox!
In our email, you will find the Forex 101 book. Just tap the button to get it!
Risk warning: ᏟᖴᎠs are complex instruments and come with a high risk of losing money rapidly due to leverage.
66.43% of retail investor accounts lose money when trading ᏟᖴᎠs with this provider.
You should consider whether you understand how ᏟᖴᎠs work and whether you can afford to take the high risk of losing your money.
Warning! Old version of the browser!
Press one of the icons below to proceed to the official website of the developer and download the latest version of your browser.

Online Forex broker
Information is not investment advice
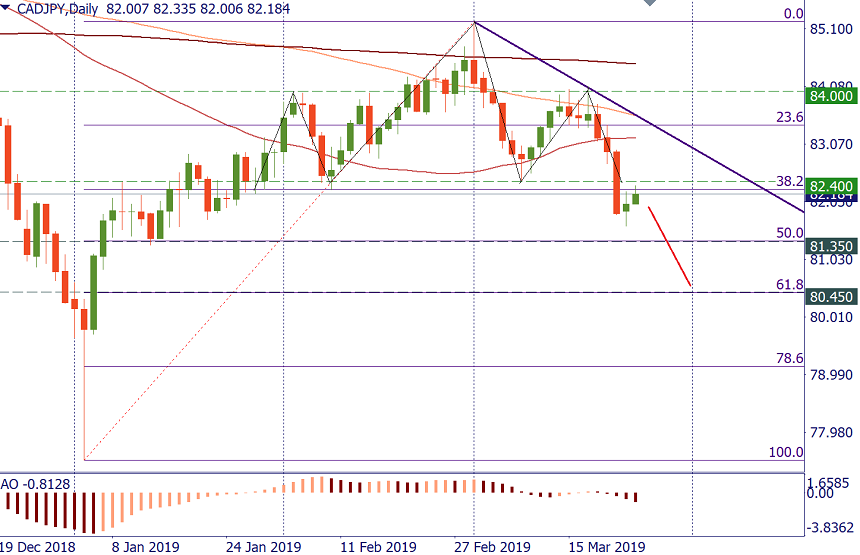
It looks like CAD/JPY formed a “Head and shoulders” pattern. The pattern may not look very pretty but it has all the required elements. The pair broke below the neckline in the 82.40 area on Friday. On Monday, the price attempted to get higher but the neckline provided resistance.
CAD/JPY is also trading below the 38.2% Fibonacci retracement of the January-March advance. As a result, the levels to target on the downside lie at 81.35 (50% Fibo) and 80.45 (61.8% Fibo).
We have outlooked several promising Forex pairs and the result can surprise you!

4H Chart Daily Chart We sent out a signal yesterday to long EUR/USD between 1…

4H Chart Daily Chart EURUSD declined back yesterday after trying to test its 1…

eurusd-is-falling-what-to-expect-from-the-future-price-movement

Greetings, fellow forex traders! Exciting news for those with an eye on the Australian market - the upcoming interest rate decision could be good news for Aussies looking to refinance or take out new loans. The Mortgage and Finance Association Australia CEO, Anja Pannek, has...

Hold onto your hats, folks! The Japanese yen took a nosedive after the Bank of Japan (BOJ) left its ultra-loose policy settings unchanged, including its closely watched yield curve control (YCC) policy. But wait, there's more! The BOJ also removed its forward guidance, which had previously pledged to keep interest rates at current or lower levels. So, what's the scoop? Market expectations had been subdued going into the meeting, but some were still hoping for tweaks to the forward guidance to prepare for an eventual exit from the bank's massive stimulus


Your request is accepted.
We will call you at the time interval that you chose
Next callback request for this phone number will be available in 00:30:00
If you have an urgent issue please contact us via
Live chat
Internal error. Please try again later