


Best Trade Ideas for April
I know we've had quite an amazing run these past few month, with over 78% accuracy in our trade ideas and sentiments, and thousands of pips in profits monthly...

Don’t waste your time – keep track of how NFP affects the US dollar!
Data Collection Notice
We maintain a record of your data to run this website. By clicking the button, you agree to our Privacy Policy.

Beginner Forex Book
Your ultimate guide through the world of trading.

Check Your Inbox!
In our email, you will find the Forex 101 book. Just tap the button to get it!
Risk warning: CFDs are complex instruments and come with a high risk of losing money rapidly due to leverage.
66.43% of retail investor accounts lose money when trading CFDs with this provider.
You should consider whether you understand how CFDs work and whether you can afford to take the high risk of losing your money.
Warning! Old version of the browser!
Press one of the icons below to proceed to the official website of the developer and download the latest version of your browser.

Online Forex broker
Information is not investment advice
What will happen?
Brent's price fell after a less than expected oil crude inventories report. Usually, the less expected report pushes the price higher, but this time everything went the opposite way.
It might be the signal of investors’ growing concerns about the OPEC+ upcoming conference, where oil global supply might be increased. Earlier, the CEO of Saudi Aramco called for a supply increase, since global oil inventories decrease too fast. From his point of view, if OPEC+ will not change its policy, it might lead to the continuation of the global energy crisis. In this case, XBR/USD will explode and reach $100 shortly.
Technical analysis
4H chart
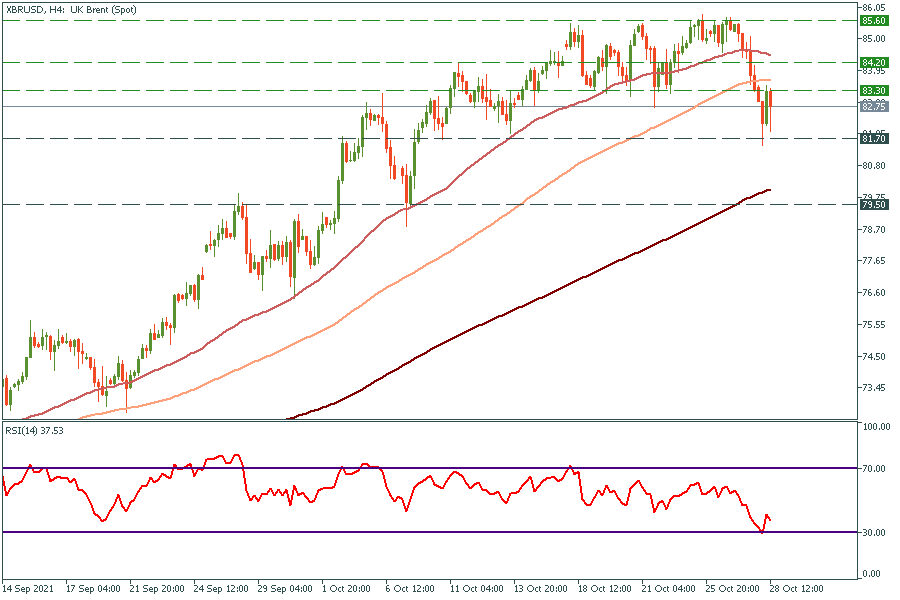
On the 4H chart, Brent fell under the 100-period moving average. At the moment it is consolidating between $81.7 and $83.3. Locally, it looks oversold according to the RSI, that’s why we can see a pullback up to $84.2 first. The main resistance will be the 50-period moving average, which has been holding the price since the middle of September 2021. If XBR/USD breaks through this resistance, it might rise as high as $85,6 again. Otherwise, if it gets rejected, it will be another proof of a downtrend beginning. The main targets for the down movement are $81.7 and $79.5.
Weekly chart
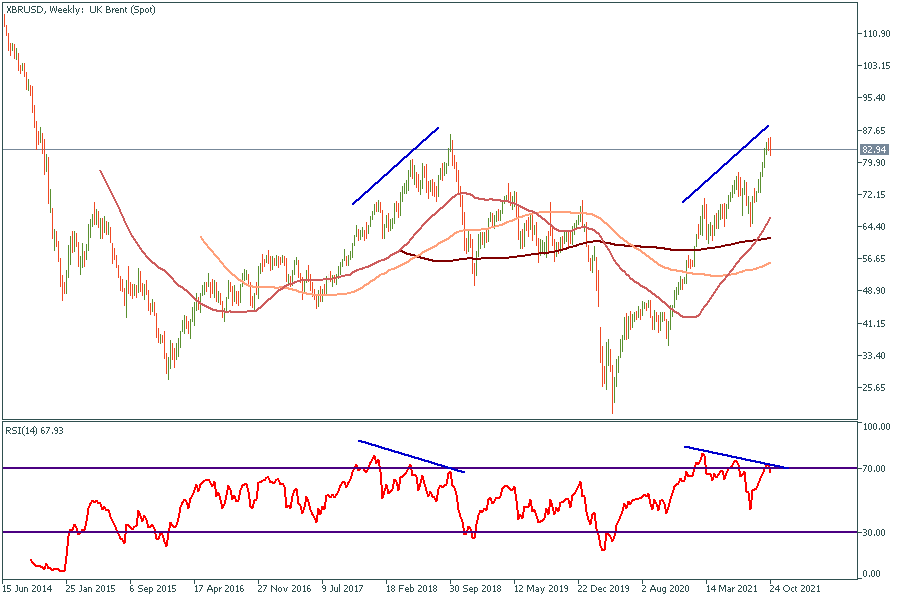
On the weekly chart, the situation which happens in 2018 repeats. The price drew 3 highs with the RSI divergence just as it did in the previous time. Later, after that pattern appeared, the price has been falling for 7 weeks straight. OPEC+ conference on August 4 will answer the question: “can technical analysis predict the future?”

I know we've had quite an amazing run these past few month, with over 78% accuracy in our trade ideas and sentiments, and thousands of pips in profits monthly...

Futures for Canada's main stock index rose on Monday, following positive global markets and gains in crude oil prices. First Citizens BancShares Inc's announcement of purchasing the loans and deposits of failed Silicon Valley Bank also boosted investor confidence in the global financial system...

Investor confidence in the global financial system has been shaken by the collapse of Silicon Valley Bank and Credit Suisse. As a result, many are turning to bearer assets, such as gold and bitcoin, to store value outside of the system without...

eurusd-is-falling-what-to-expect-from-the-future-price-movement

Greetings, fellow forex traders! Exciting news for those with an eye on the Australian market - the upcoming interest rate decision could be good news for Aussies looking to refinance or take out new loans. The Mortgage and Finance Association Australia CEO, Anja Pannek, has...

Hold onto your hats, folks! The Japanese yen took a nosedive after the Bank of Japan (BOJ) left its ultra-loose policy settings unchanged, including its closely watched yield curve control (YCC) policy. But wait, there's more! The BOJ also removed its forward guidance, which had previously pledged to keep interest rates at current or lower levels. So, what's the scoop? Market expectations had been subdued going into the meeting, but some were still hoping for tweaks to the forward guidance to prepare for an eventual exit from the bank's massive stimulus


Your request is accepted.
We will call you at the time interval that you chose
Next callback request for this phone number will be available in 00:30:00
If you have an urgent issue please contact us via
Live chat
Internal error. Please try again later