

Bezaubernde Prognosen für 2022
Hallo aus dem fernen 2022! Die FBS-Analysten sind mit Hilfe von Magie in die Zukunft gereist und haben einige lustige Vorhersagen für Sie getroffen.

Verschwenden Sie nicht Ihre Zeit - beobachten Sie, wie die NFP den US-Dollar beeinflusst!
Hinweis zur Datenerfassung
Wir speichern Ihre Daten für den Betrieb dieser Website. Durch Drücken der Taste stimmen Sie unserer Datenschutzpolitik zu.

Forex-Buch für Anfänger
Ihr Leitfaden durch die Welt des Handels.

Überprüfen Sie Ihre Inbox!
In unserer E-Mail finden Sie das Buch Forex 101. Tippen Sie einfach auf die Schaltfläche, um es zu erhalten!
Risikowarnung: ᏟᖴᎠs sind komplexe Instrumente und bringen ein hohes Risiko mit sich, aufgrund von Hebelwirkung schnell Geld zu verlieren.
70,72 % der Privatanleger-Konten verlieren Geld, wenn sie mit diesem Anbieter ᏟᖴᎠs handeln.
Sie sollten sich überlegen, ob Sie verstehen, wie ᏟᖴᎠs funktionieren und ob Sie es sich leisten können, zu riskieren, Ihr Geld zu verlieren.
Warnung! Alte Version des Browsers!
Drücken Sie eines der Symbole unten, um auf die offizielle Website des Entwicklers vorzugehen und die neueste Version Ihres Browsers herunterzuladen.

Online Forex- broker
Informationen sind keine Investitionsberatung
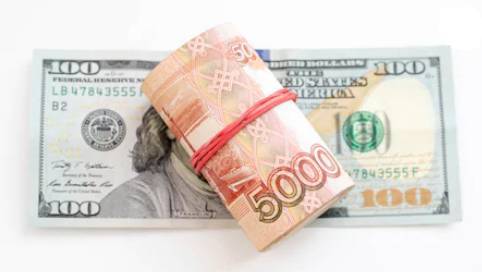
The current president assumed power in Russia in 2000 and stayed in power de facto during these 20 years. Leaving aside political questions, let’s focus on the economy and try to find a correlation between the price of oil and the price of the USD against the RUB.
Until 2015, while the oil price was above $20 per barrel and kept rising sometimes to cosmic highs like $140, the USD/RUB has been trading stable at 30. Eventually, the WTI oil price lost more than half its value dropping from $100 to $40. Simultaneously, the USD/RUB gained more than 100% flying from 30 to 70. Interestingly enough, both the oil price and the USD/RUB are now where they were in 2015 right before the “sudden” change. In any case, that was the end of Russia’s “gold era” of sky-high oil prices, and hence the RUB got substantially marked down.
The recent Russia-Saudi oil price war made the USD/RUB take yet a higher baseline level. The most recent spike in the USD/RUB is exactly where the WTI dropped to $20 (and even below 0 in some markets). In fact, it is visible that the shape of the chart after 2015 (marked by the green vertical line) is almost perfectly inverted between the oil price and the USD/RUB.
That’s why, specifically with the USD/RUB, one of the main fundamental factors defining this currency pair is the oil price. The higher it is – the better for the oil-exporting Russian economy, and hence, the stronger (or at least more stable) the RUB may be. This comes as a big facilitator to predict the USD/RUB: just keep your hand on the pulse of the oil price, and you will know where the USD/RUB goes. For a trader, what can be more convenient?
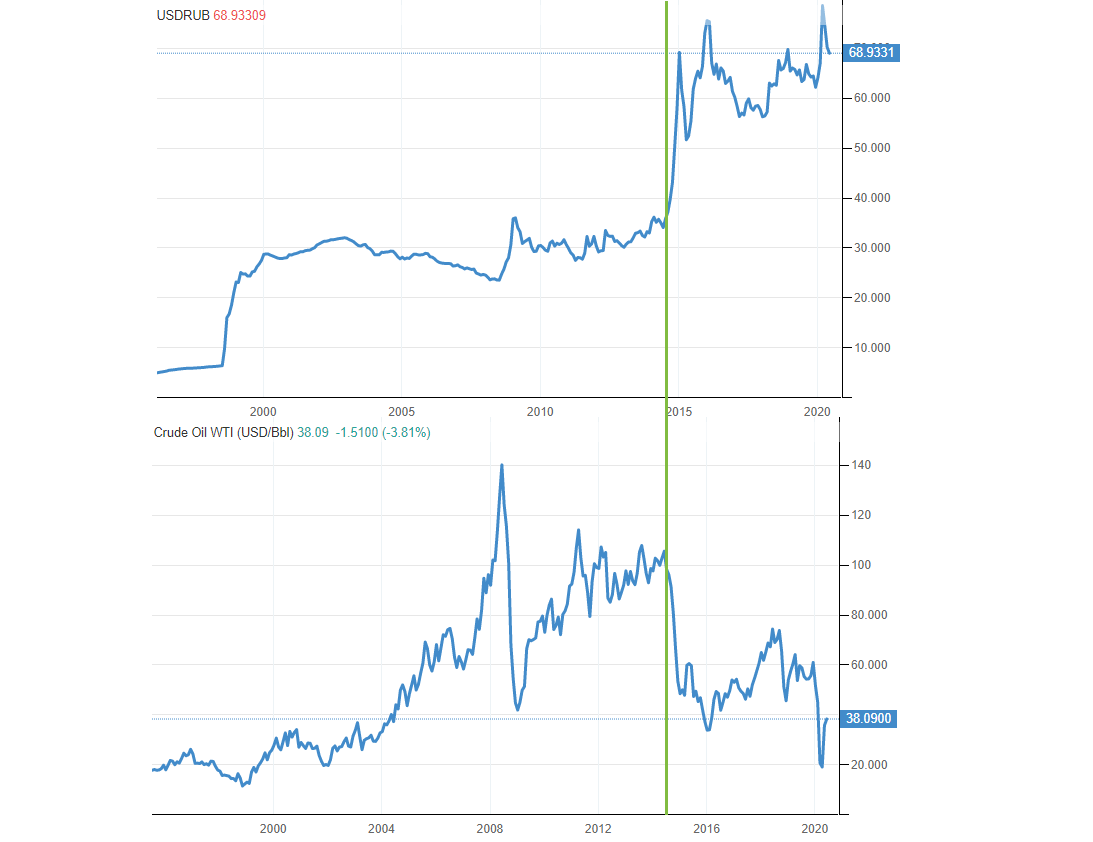
Source: tradingeconomics.com
The strategic outlook for the USD/RUB is an uptrend in any case. That is dictated by the supremacy of the American economy against the Russian – the latter simply cannot stand the competition and is doomed to lose, just as any developing economy with the currencies such as the MXN, BRL, and TRY. As we can see on the chart above, even after a bullish rally, an uptrend was rarely challenged – rather, tested, at times. For example, the years 2000-2015 can be taken as a period of a relative stability of the USD/RUB at or below the resistance of 30, with 2003-2008 showing a slow decline. That was ended with the mentioned plunge in the oil price that pushed the USD/RUB far beyond 30.
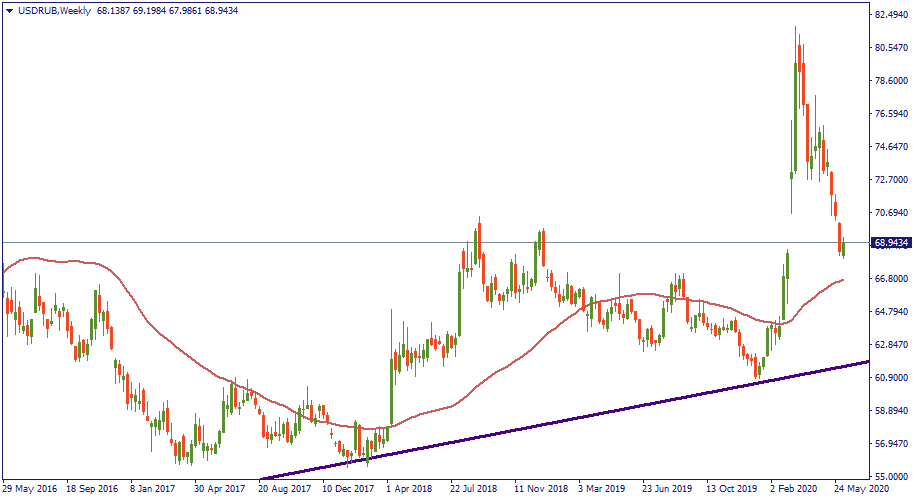
The weekly chart of USD/RUB below presents a volatile picture with an underlying upward trajectory. While the price may keep going down for a while, it is unlikely it would break the larger uptrend. More probably, it will come to test the uptrend’s bottom at 62-63 and will get back up to 69-70.
In any case, fundamentally speaking, there is little ground to expect the RUB to gain value against the USD in the long term. At maximum, it will stay stable where it is now. That should serve as an ideal background for trading that may rely on this guaranteed fundamentality. Hence, unless the oil price makes a substantial drop once again, one may safely buy the USD/RUB to see it grow in a few months or even weeks.
Hallo aus dem fernen 2022! Die FBS-Analysten sind mit Hilfe von Magie in die Zukunft gereist und haben einige lustige Vorhersagen für Sie getroffen.

Das Unternehmen wird seine Daten am Freitag vorlegen. Was sollten Sie wissen?

Facebook hat seinen Namen in Meta geändert, um mit alten Gerüchten aufzuräumen und eine neue Marke aufzubauen, die frei von Kritik und persönlichen Datenlecks ist.
Die Pandemie belastet weiterhin die Wirtschaftstätigkeit in China, der Krieg in der Ukraine beeinträchtigt die gesamte europäische Wirtschaft, und die Bemühungen der Federal Reserve zur Inflationskontrolle drohen eine Rezession auszulösen.
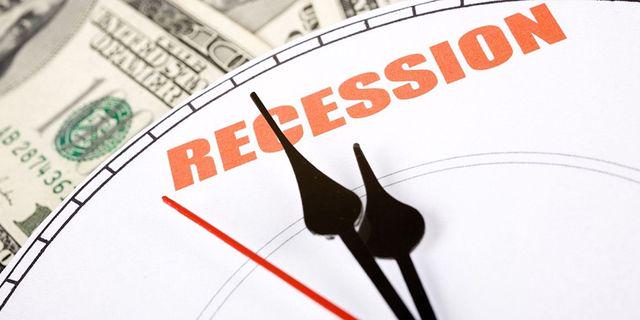
Wenn die Inflation 4 % übersteigt und die Arbeitslosigkeit unter 5 % fällt, tritt die US-Wirtschaft innerhalb von zwei Jahren in eine Rezession ein.
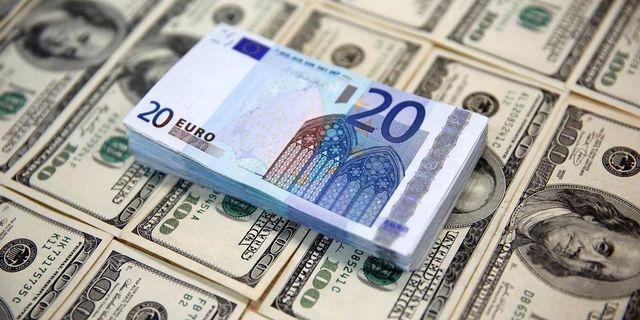
Taubenhafte EZB und falkenhafte Fed malen eine rückläufige Perspektive für EUR/USD. Ist der Rückgang auf 1,0770 der nächste Halt?


Ihr Antrag wird akzeptiert.
Wir werden Sie in dem von Ihnen gewählten Zeitintervall anrufen
Nächste Rückrufwunsch für diese Telefonnummer wird verfügbar in 00:30:00
Wenn Sie ein dringendes Problem haben, kontaktieren Sie uns bitte per
Live-Chat
Interner Fehler. Bitte versuchen Sie später noch einmal