


Estrategia de Williams
Bill Williams es el creador de algunos de los indicadores del mercado más populares: oscilador asombroso, fractales, alligator y gator.

¡No pierdas tu tiempo – mantente informado para ver cómo las NFP afectan al USD!
Aviso de Recopilación de Datos
Mantenemos un registro de tus datos para ejecutar este sitio web. Al hacer click en el botón, estás aceptando nuestra Política de Privacidad.

Manual para Principiantes de Forex
Tu guía definitiva a través del mundo del trading.

¡Revisa Tu Correo!
En nuestro correo electrónico, encontrarás el Manual de Forex 101. ¡Solo toca el botón para descargarlo!
Advertencia de Riesgo: Los ᏟᖴᎠs son instrumentos complejos y tienen un alto riesgo de pérdida de dinero rápidamente debido al apalancamiento.
El 70,72% de las cuentas de los inversores minoristas pierden dinero al operar ᏟᖴᎠs con este proveedor.
Deberías tener en consideración si comprendes el funcionamiento de los ᏟᖴᎠs y si puedes darte el lujo de arriesgarte a perder tu dinero.
¡Atención! ¡Su navegador no está actualizado!
Presione uno de los iconos de abajo para pasar a la página oficial del desarrollador y descargar la última versión del navegador.

Broker De Forex Online
Esta información no son consejos para inversión
Cada trader necesita tener un sistema de trading. Es un conjunto de reglas que se siguen antes, durante y después de cada operación. Una de las partes críticas del sistema de trading es una razón para salir o entrar de la operación. En este artículo, te contaremos sobre estas razones.
Los patrones de gráficos están de un lado, y las velas están del otro. ¿Quién ganará?
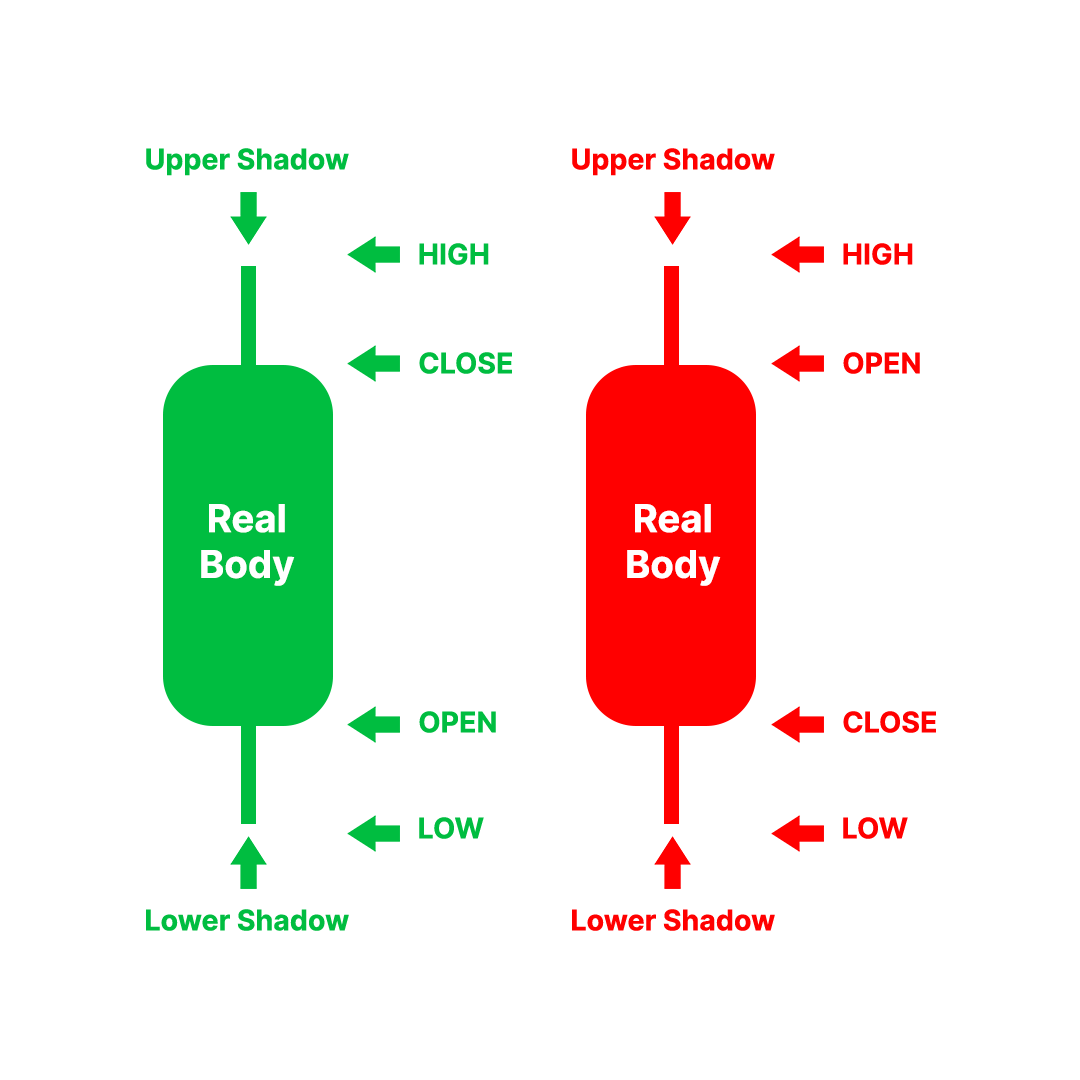
Cada vela consta de varias partes. Tiene un cuerpo real y dos sombras. Gracias a las velas japonesas, podemos leer los movimientos del mercado, incluyendo el precio al principio y al final de cada período de trading. Lee más en la guía completa de velas japonesas. Ahora veamos diferentes patrones de velas.
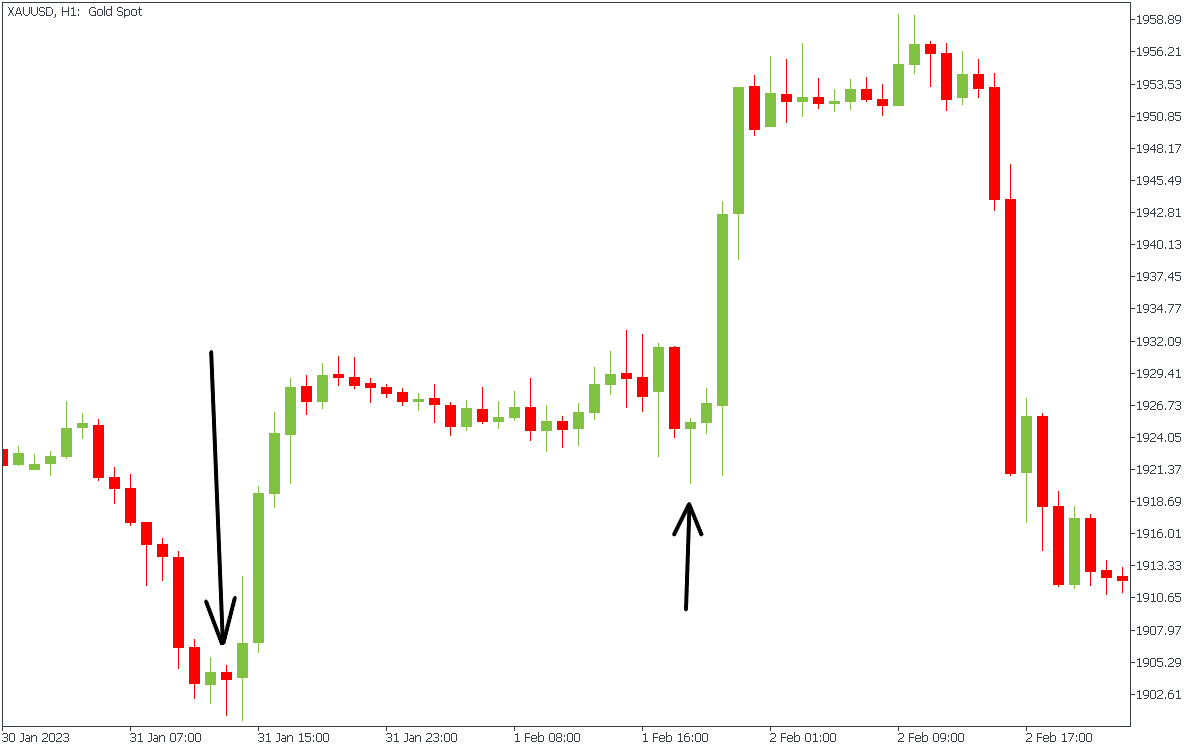
El martillo es un patrón de vela alcista que indica una posible reversión de tendencia. El patrón consta de una vela con un cuerpo pequeño y una larga sombra inferior, lo que sugiere que los compradores podrían impulsar el precio al alza después de un período de presión de venta.
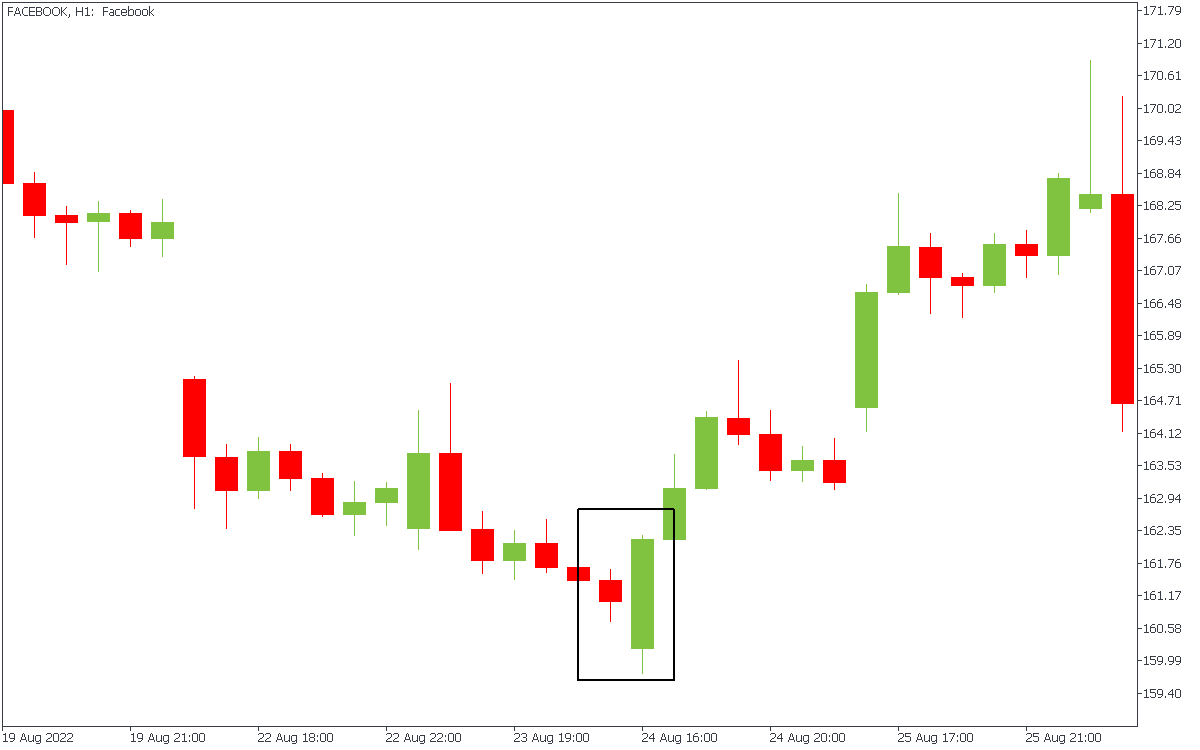
Este patrón de reversión alcista ocurre cuando una vela verde más grande envuelve por completo a una vela roja más pequeña. La segunda vela debe comenzar debajo de la sombra de la primera y terminar por encima de su punto más alto. El patrón nos dice que los compradores han tomado el control del mercado.
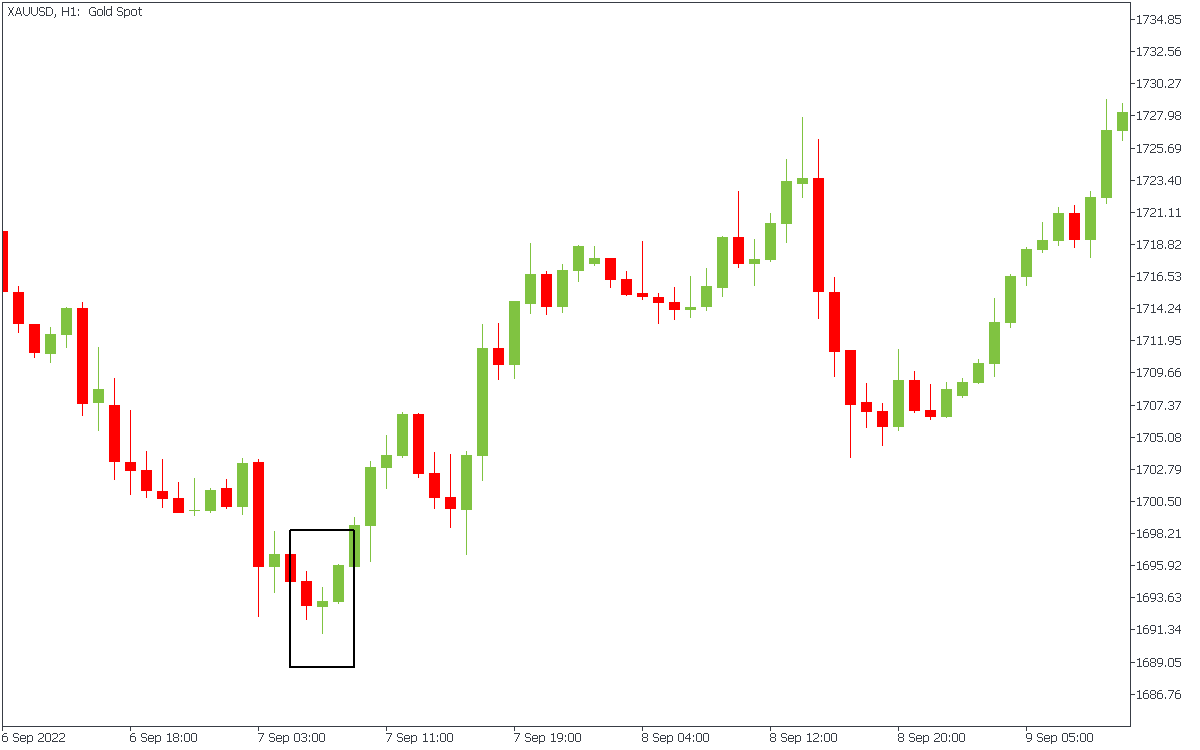
La estrella de la mañana es un patrón de reversión alcista que consta de tres velas. La primera es una vela bajista larga, seguida de una pequeña vela y luego una vela alcista larga. El patrón sugiere que una reversión de tendencia es inminente. Ten en cuenta que la vela central por lo general tiene cuerpo y sombras cortas, lo que muestra que los toros y los osos no pudieron mover el precio.
Además, los traders buscan brechas en el precio para confirmar el patrón.
Este es un patrón de reversión bajista en la cima de una tendencia alcista. La vela tiene un cuerpo pequeño y una larga sombra inferior, lo que sugiere que los compradores no han podido mantener el impulso alcista.
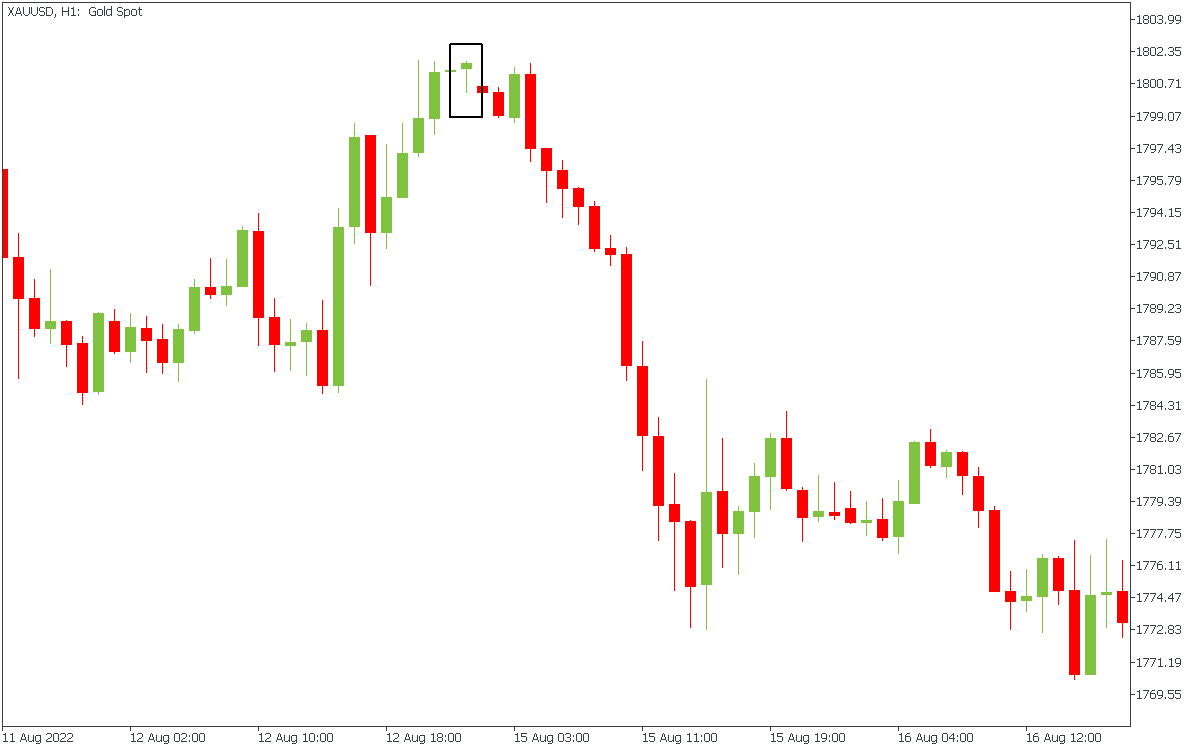
Este patrón de reversión ocurre en la parte superior de un movimiento. El patrón se caracteriza por un cuerpo pequeño y una larga sombra superior, lo que sugiere que los vendedores han podido presionar el precio a la baja después de un período de presión de compra.
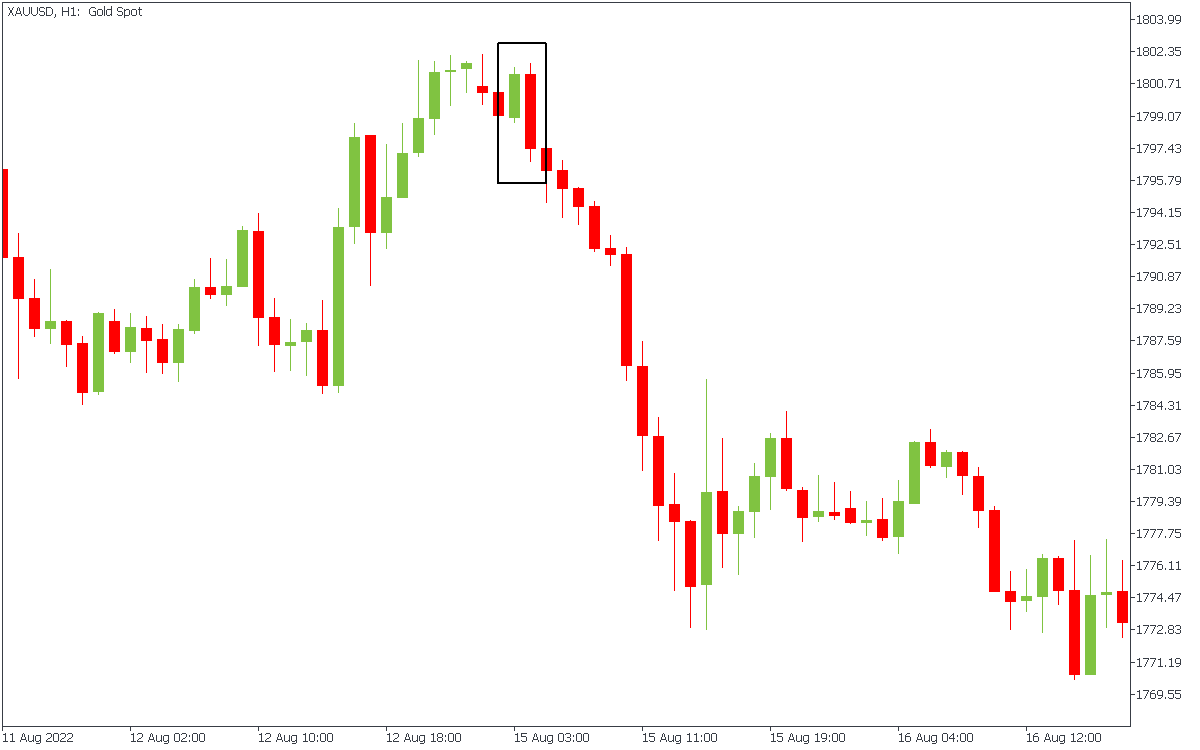
Un patrón de reversión bajista ocurre cuando una vela roja más grande envuelve por completo a una vela verde más pequeña. Se ve exactamente como un patrón envolvente alcista con las velas cambiadas. La primera es una vela verde y la segunda es roja. Por lo general, los vendedores entran en juego después de que termina el patrón envolvente bajista.
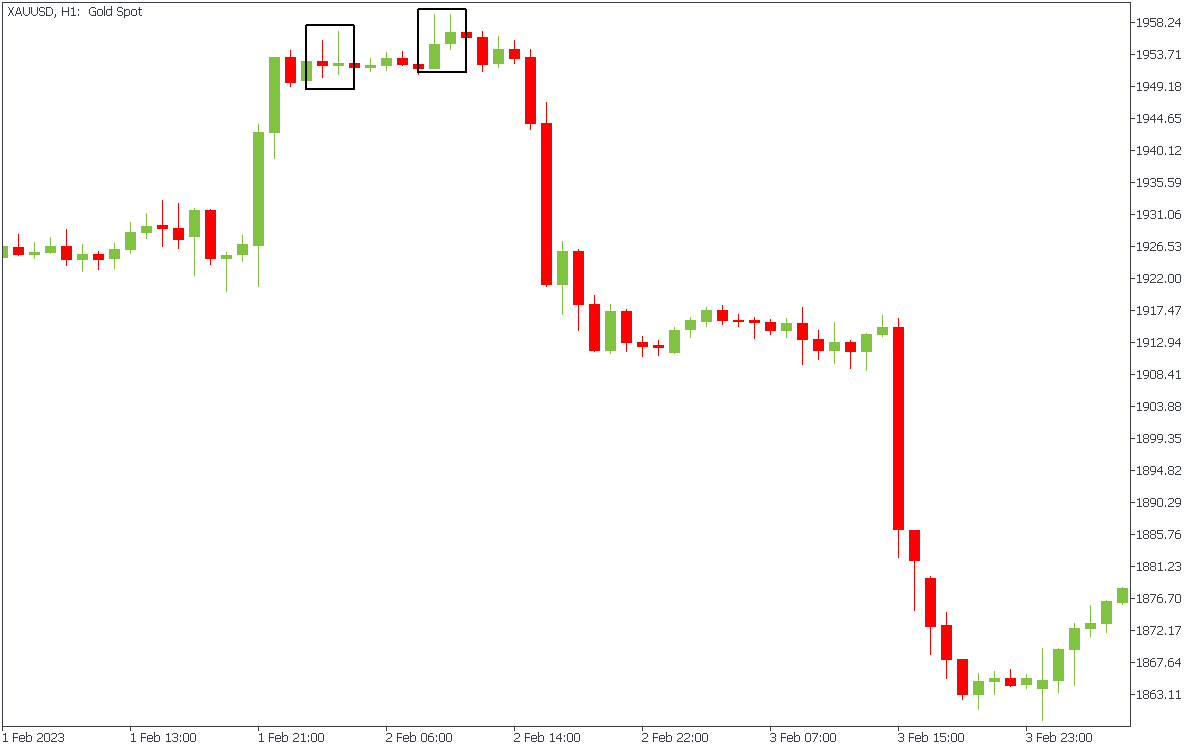
Es mucho más eficiente cuando se ven varios patrones de reversión de velas consecutivos. Por ejemplo, en la figura de arriba, la envoltura bajista ha aparecido después de dos estrellas fugaces, confirmando la próxima tendencia bajista.
A diferencia de los patrones de velas, los patrones de gráficos tardan más tiempo en formarse. Por ejemplo, cuando ocurre una envoltura bajista, solo necesitas dos velas para evaluar la situación. En cambio, un patrón de gráficos toma al menos diez velas. Aquí hemos recolectado diferentes patrones de gráficos para ti.
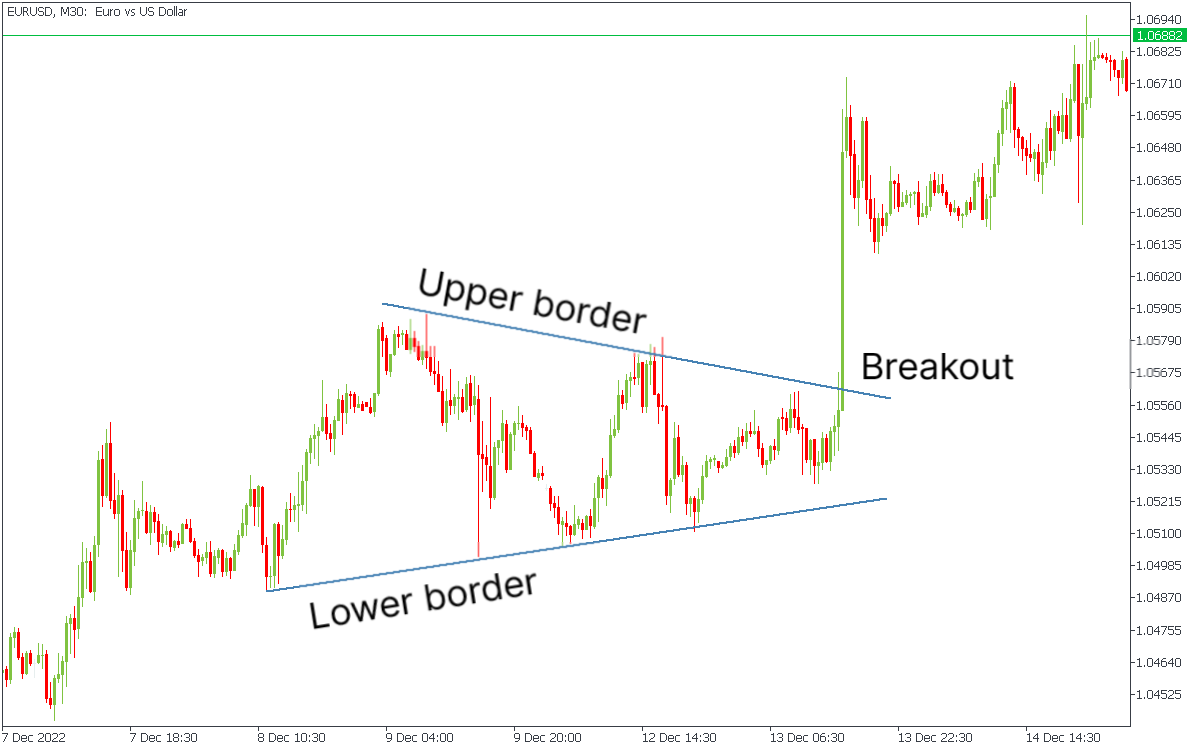
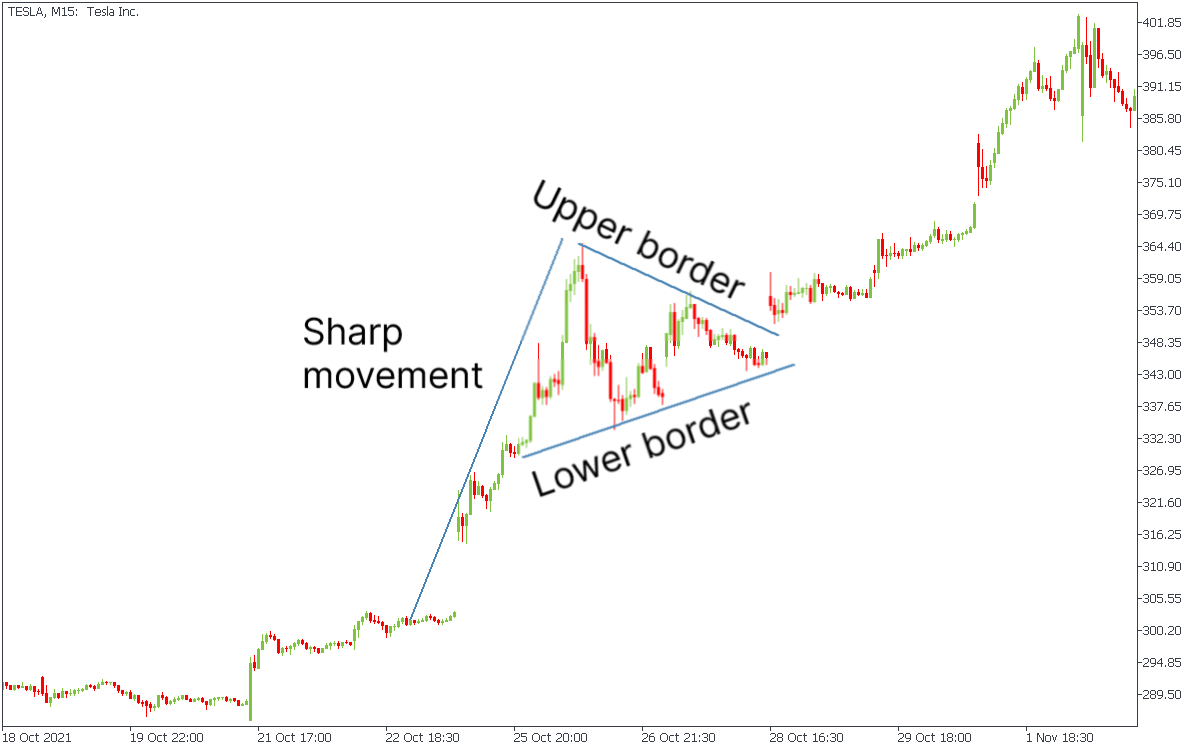
Este es un patrón de continuación que se forma cuando los movimientos de precio se encuentran dentro de dos líneas de tendencia convergentes. Una ruptura en cualquier dirección sugiere una continuación de la tendencia previa. Hay tres tipos de triángulos:
En el gráfico a continuación, puedes ver un triángulo simétrico.
Este patrón de continuación se forma cuando un breve período de consolidación sigue a un movimiento de precio abrupto. Se asemeja a un pequeño triángulo simétrico y sugiere que la tendencia anterior continuará.
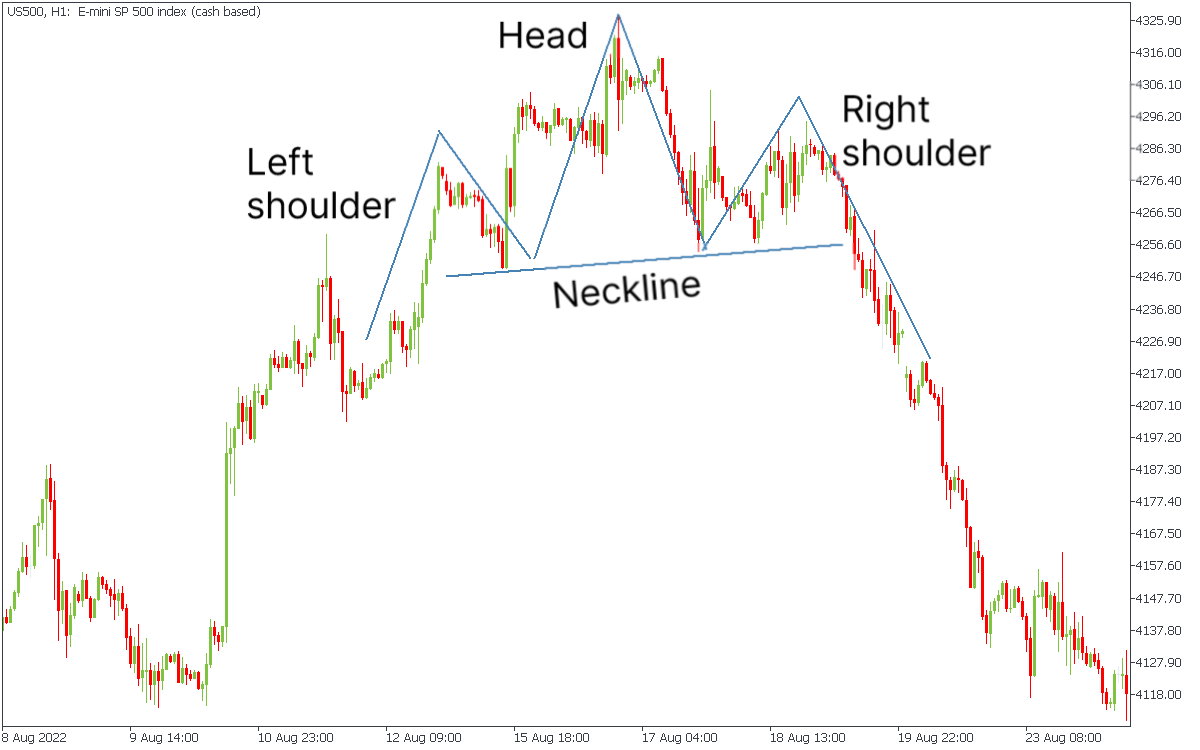
Este es un patrón de reversión que consta de tres picos, siendo el pico medio el más alto. El patrón sugiere que el mercado está cambiando de una tendencia alcista a una tendencia bajista.
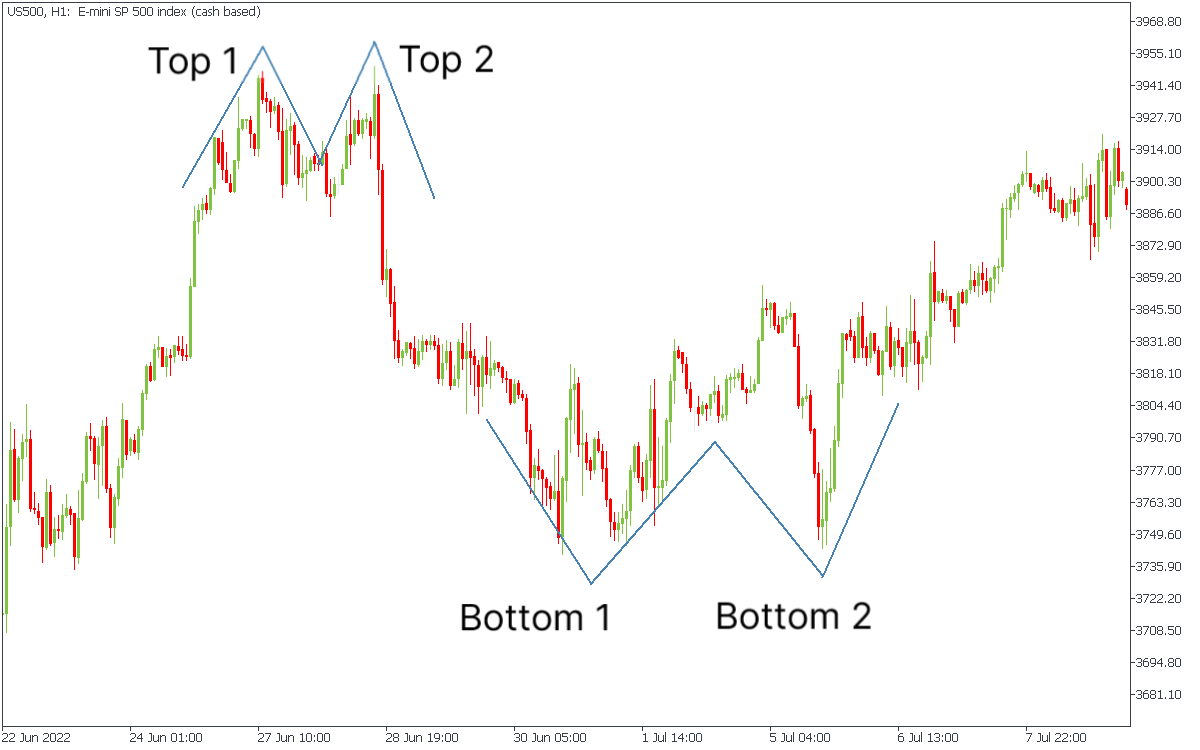
Estos patrones ocurren cuando el precio alcanza un punto alto o bajo dos veces, con un período de declive o aumento en el medio. Un doble techo o un doble suelo sugiere que el mercado puede revertirse.
Aquí están las principales diferencias entre los patrones de gráficos y las velas:
En conclusión, los patrones de gráficos y las velas son herramientas valiosas para que los traders analicen y predigan los movimientos del mercado. Es esencial tener un sistema de trading y una razón clara para entrar o salir de una operación, ya sea basado en patrones de gráficos, velas o ambos. En última instancia, elegir entre patrones de gráficos y velas depende de la preferencia personal y la estrategia de trading.
Legal disclaimer: The content of this material is a marketing communication, and not independent investment advice or research. The material is provided as general market information and/or market commentary. Nothing in this material is or should be considered to be legal, financial, investment or other advice on which reliance should be placed. No opinion included in the material constitutes a recommendation by Tradestone Ltd or the author that any particular investment security, transaction or investment strategy is suitable for any specific person. All information is indicative and subject to change without notice and may be out of date at any given time. Neither Tradestone Ltd nor the author of this material shall be responsible for any loss you may incur, either directly or indirectly, arising from any investment based on any information contained herein. You should always seek independent advice suitable to your needs.

Bill Williams es el creador de algunos de los indicadores del mercado más populares: oscilador asombroso, fractales, alligator y gator.

Las estrategias de tendencia son buenas: pueden dar resultados significativamente buenos en cualquier temporalidad y con cualquier activo. La idea principal de la estrategia ADX basada en tendencia es intentar posicionarse en el comienzo de la tendencia.

Las estrategias contra tendencia siempre son las más peligrosas, pero también las más rentables. Nos complace presentar una excelente estrategia contra tendencia para trabajar en cualquier mercado y con cualquier activo.

Escenario bajista: Ventas por debajo de 1.0820 / 1.0841... Escenario alcista: Compras sobre 1.0827...

Escenario bajista: Ventas por debajo de 2200 / 2194 con TP1: 2190, TP2: 2180 y TP3: 2172 con S…

Escenario bajista: Ventas por debajo de 5220 ... Escenario alcista: Compras sobre 5225 (Si el precio falla en romper por debajo de 5220 con decisión)


Su solicitud ha sido aceptada
Te llamaremos en el intervalo de tiempo que elijas
La próxima solicitud de devolución de llamada para este número de teléfono estará disponible en 00:30:00
Si tienes algún problema urgente, contáctanos a través del
Chat en vivo
Error interno. Por favor, inténtelo nuevamente más tarde