


China’s rebound and energy prices
China's economy is rocketing. On the other hand OPEC+ countries take the decision to cut the production. What will be the impact on the oil price?

Don’t waste your time – keep track of how NFP affects the US dollar!
Data Collection Notice
We maintain a record of your data to run this website. By clicking the button, you agree to our Privacy Policy.

Join Us on Facebook
Stay on top of company updates, trading news, and so much more!
Thanks, I already follow your page!
Beginner Forex Book
Your ultimate guide through the world of trading.

Check Your Inbox!
In our email, you will find the Forex 101 book. Just tap the button to get it!
Risk warning: ᏟᖴᎠs are complex instruments and come with a high risk of losing money rapidly due to leverage.
69.21% of retail investor accounts lose money when trading ᏟᖴᎠs with this provider.
You should consider whether you understand how ᏟᖴᎠs work and whether you can afford to take the high risk of losing your money.
Warning! Old version of the browser!
Press one of the icons below to proceed to the official website of the developer and download the latest version of your browser.

Online Forex broker
Information is not investment advice
US100 broke through the strong resistance trendline, following July's inflation numbers on Wednesday, which were less than analysts expected. The expectations of an upcoming inflation decrease and the fact that, despite the Federal Reserve's aggressive interest rate increases, companies remain profitable, and the jobs market is still in good shape helped to improve investors' sentiment.
Moreover, on Thursday, the Producers price index (PPI) also confirmed possible inflation cool down, as numbers underperformed the forecasts.
The NASDAQ 100 (US100) is a capitalization-weighted index, which includes companies from major industry groups, including computer hardware/software, retail/wholesale trade, biotechnology, and telecommunications.
Usually, investors treat these companies as risky investments as many have low revenue relative to debt. Therefore, this index is the main indicator of the traders' and investors' sentiment.
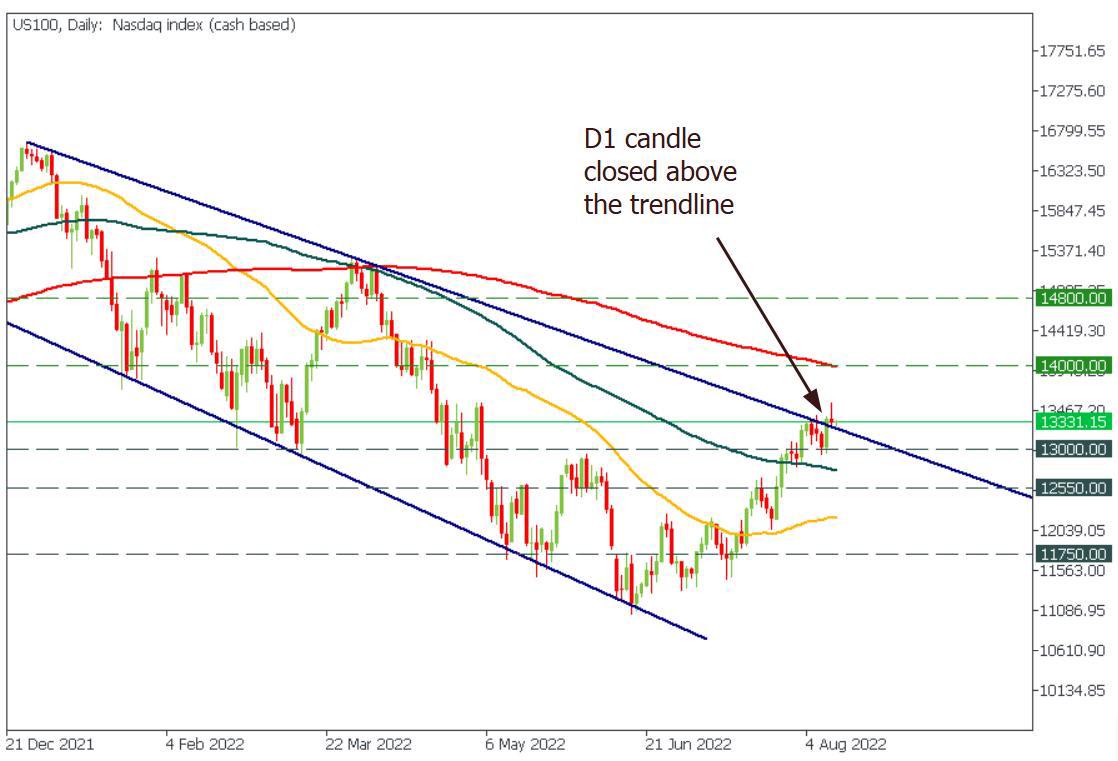
US100 breakout on the D1 timeframe
If US100 doesn’t return under the trendline by the end of the week, traders might consider looking for a buy trade with the target at 14 000.
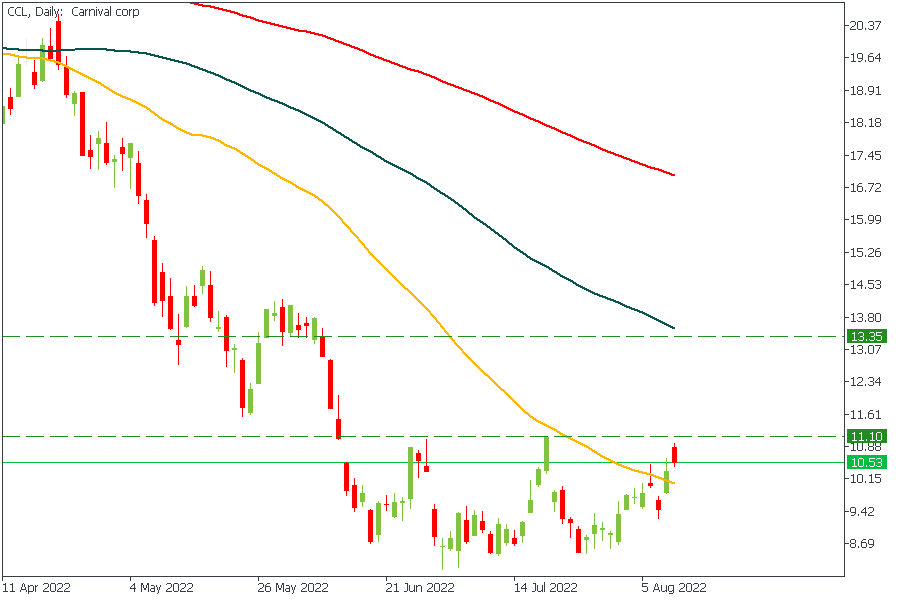
Although the stock is not included in US100, the overall stock market growth might boost CCL. The price has formed a triple bottom pattern with the resistance at $11.10. Traders should consider buying the stock after the breakout of this level, with the target at $13.35 (21% potential profit).
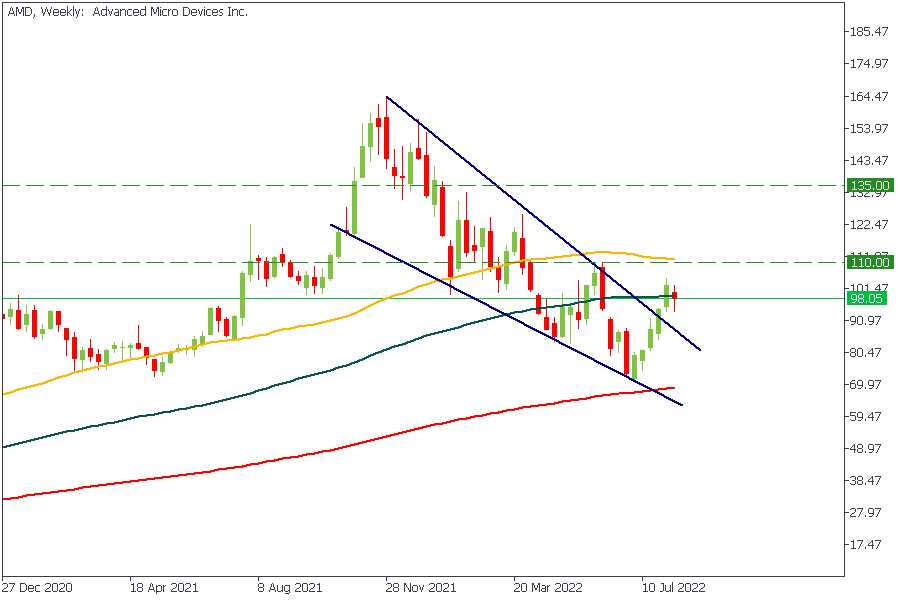
The price has formed a double bottom inside of the bullish wedge. The wedge breakout has already happened, highlighting the possibility of an upcoming pump. Traders should consider buying AMD stock after the price breaks above $110.00, with the target at $135.00.
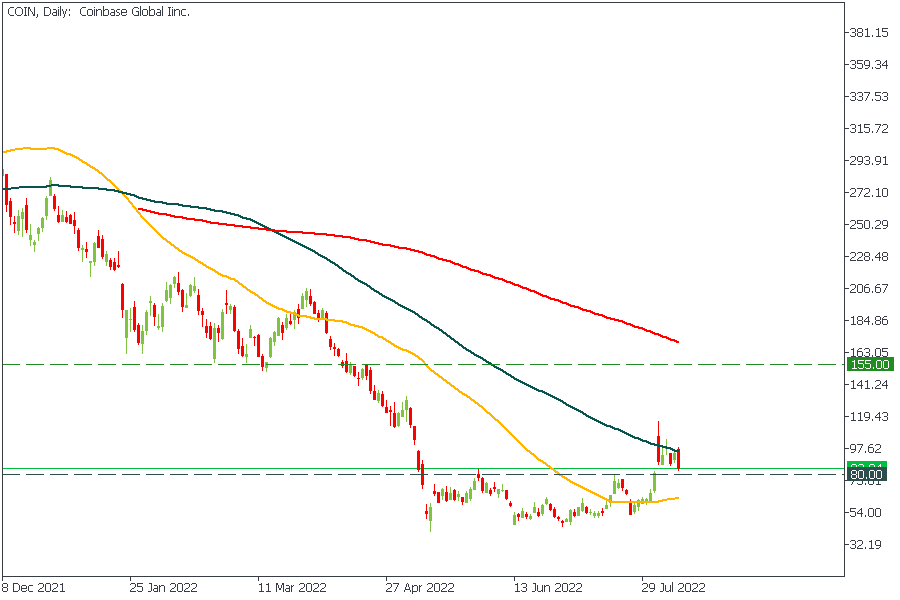
COIN broke out of the horizontal consolidation, and currently, the price is retesting the breakout from above. If buyers hold the $80.00 support, they will have all chances to push the stock to $155.00.
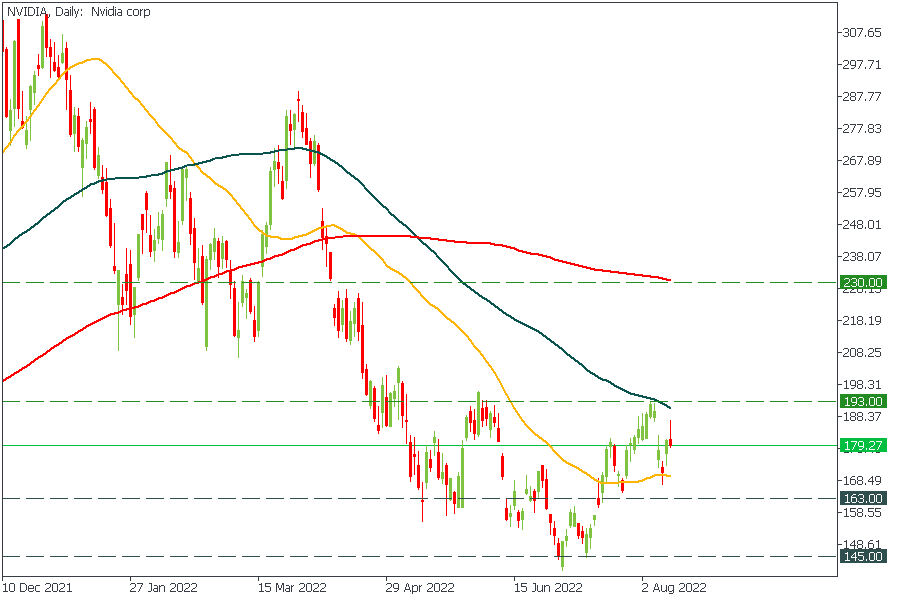
Nvidia is consolidating between 163.00 and 193.00. Currently, the price is forming an inverted head-with-shoulders pattern. The breakout of 193.00 resistance will confirm the pattern and set the target at 230.00.
If the price goes below 163.00, it will go towards 145.00.
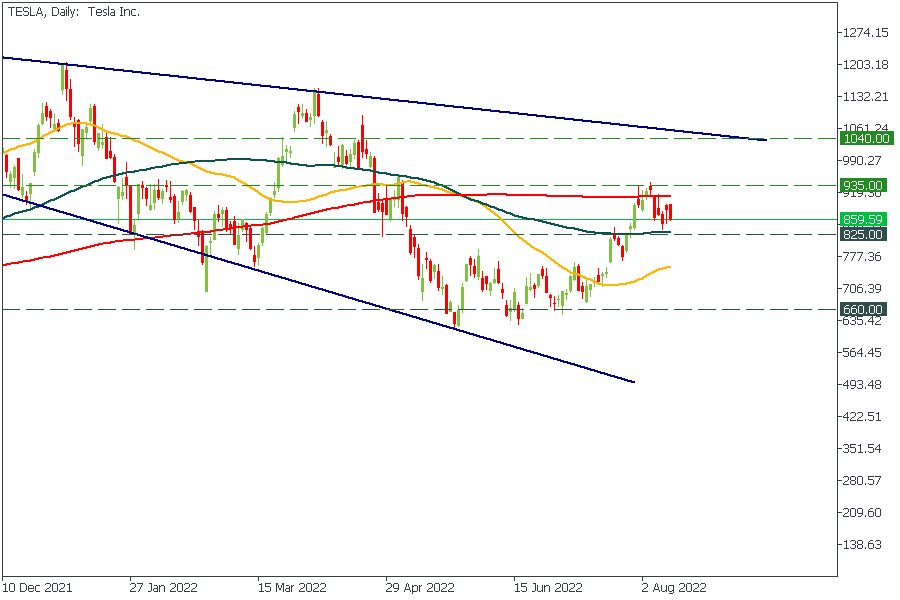
Tesla stock is trading inside the inverted falling wedge, which usually works as a bullish pattern. If the price breaks above 935.00, traders should consider following the trend with the target at 1040.00. Trade declines if the price falls below 825.00.
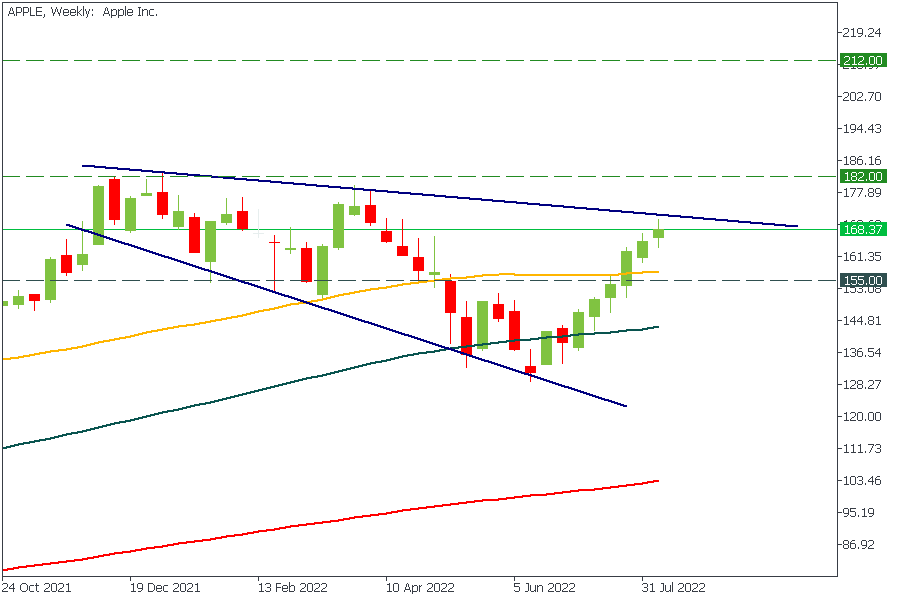
Apple’s stock also moves inside an inverted falling wedge. The rally will start after the breakout of the wedge’s upper border. In this case, the first targets will be 182.00 and 212.00.
If the price doesn’t break the resistance, it will decline to 155.00.

China's economy is rocketing. On the other hand OPEC+ countries take the decision to cut the production. What will be the impact on the oil price?

Oil prices fell to a three-month low following the release of US inflation data which was in line with expectations…

The US dollar index has lost around 12% since October 2022 till its local low at the end of January 2023.

eurusd-is-falling-what-to-expect-from-the-future-price-movement

Greetings, fellow forex traders! Exciting news for those with an eye on the Australian market - the upcoming interest rate decision could be good news for Aussies looking to refinance or take out new loans. The Mortgage and Finance Association Australia CEO, Anja Pannek, has...

Hold onto your hats, folks! The Japanese yen took a nosedive after the Bank of Japan (BOJ) left its ultra-loose policy settings unchanged, including its closely watched yield curve control (YCC) policy. But wait, there's more! The BOJ also removed its forward guidance, which had previously pledged to keep interest rates at current or lower levels. So, what's the scoop? Market expectations had been subdued going into the meeting, but some were still hoping for tweaks to the forward guidance to prepare for an eventual exit from the bank's massive stimulus


Your request is accepted.
We will call you at the time interval that you chose
Next callback request for this phone number will be available in 00:30:00
If you have an urgent issue please contact us via
Live chat
Internal error. Please try again later