


China’s rebound and energy prices
China's economy is rocketing. On the other hand OPEC+ countries take the decision to cut the production. What will be the impact on the oil price?
For a seamless experience, click “Redirect me.”

Don’t waste your time – keep track of how NFP affects the US dollar!
Data Collection Notice
We maintain a record of your data to run this website. By clicking the button, you agree to our Privacy Policy.

Beginner Forex Book
Your ultimate guide through the world of trading.

Check Your Inbox!
In our email, you will find the Forex 101 book. Just tap the button to get it!
Risk warning: ᏟᖴᎠs are complex instruments and come with a high risk of losing money rapidly due to leverage.
71.99% of retail investor accounts lose money when trading ᏟᖴᎠs with this provider.
You should consider whether you understand how ᏟᖴᎠs work and whether you can afford to take the high risk of losing your money.
Warning! Old version of the browser!
Press one of the icons below to proceed to the official website of the developer and download the latest version of your browser.

Online Forex broker
Information is not investment advice
Western countries are trying to find other options for oil and gas supplies after a 10th package of sanctions, which will put more pressure on Russian oil and decrease global oil supply. Italy, for example, is in talks with Libya.
However, the lingering question is "will the reopening of the Chinese economy pool enough demand to alter the decline in the outcome of oil price in February?"
Oil prices usually work as a leading indicator for the US dollar. Rising prices lead to inflation increase, which forces the Fed to become more hawkish. As a result, the greenback strengthens.
On the other hand, lower oil prices cool down inflation, making the Federal Reserve to act more dovish. As a result, the USD declines.
In light of the fundamental breakdown above, we will draw our conclusions from the outlook of price on the charts using price action.
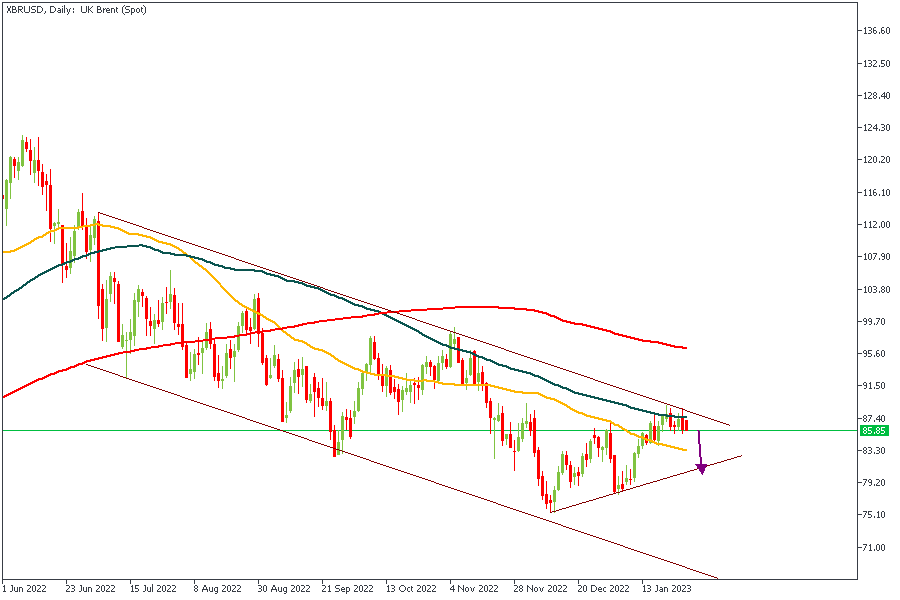
On the daily timeframe, Brent has been steadily bearish since March, 2022, declining by over 33% from the high. At the present, price has created a downward channel and is currently retesting the trendine resistance. The presence of the 100-Day SMA at that level as a confluence simply makes a stronger case for a bearish continuation from that point.
Analysts’ Expectations:
Direction: Bearish
Target: $80
Invalidation: $90
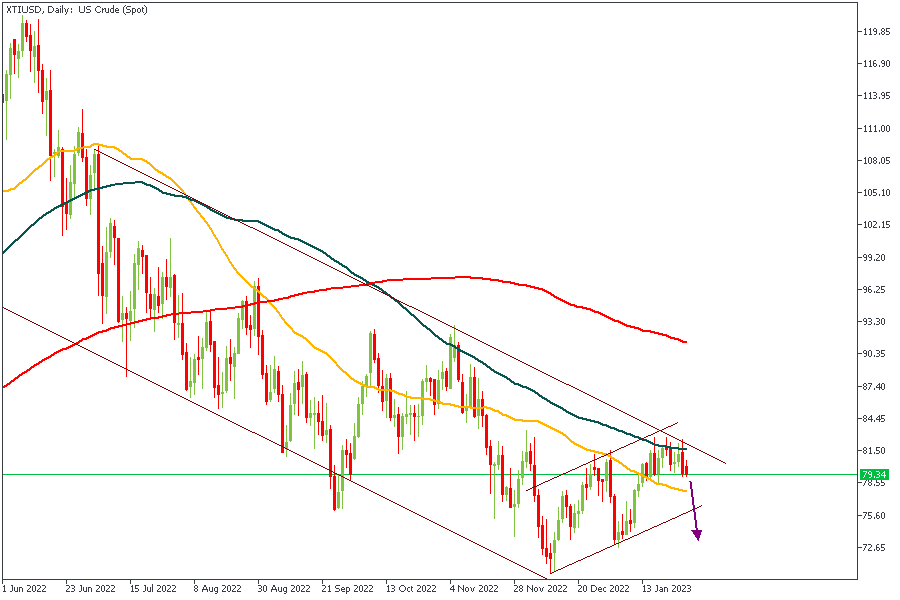
On the daily timeframe, XTIUSD formed a rising channel inside a downward channel. The implication of this is that the point of intersection of trendlines from both channels acts as a strong area of resistance. Considering the presence of the 100-Day SMA as an added confluence, it is only logical to expect lower prices on oil over the next couple of days.
Analysts’ Expectations:
Direction: Bearish
Target: $77
Invalidation: $82
Based on the analyses above, it is safe to expect bearish price action of the oil market.
The trading of CFDs comes at a risk. Thus, to succeed, you have to manage risks properly. To avoid costly mistakes while you look to trade these opportunities, be sure to do your due diligence and manage your risk appropriately.
Legal disclaimer: The content of this material is a marketing communication, and not independent investment advice or research. The material is provided as general market information and/or market commentary. Nothing in this material is or should be considered to be legal, financial, investment or other advice on which reliance should be placed. No opinion included in the material constitutes a recommendation by Tradestone Ltd or the author that any particular investment security, transaction or investment strategy is suitable for any specific person. All information is indicative and subject to change without notice and may be out of date at any given time. Neither Tradestone Ltd nor the author of this material shall be responsible for any loss you may incur, either directly or indirectly, arising from any investment based on any information contained herein. You should always seek independent advice suitable to your needs.

China's economy is rocketing. On the other hand OPEC+ countries take the decision to cut the production. What will be the impact on the oil price?

Oil prices fell to a three-month low following the release of US inflation data which was in line with expectations…

The US dollar index has lost around 12% since October 2022 till its local low at the end of January 2023.

eurusd-is-falling-what-to-expect-from-the-future-price-movement

Greetings, fellow forex traders! Exciting news for those with an eye on the Australian market - the upcoming interest rate decision could be good news for Aussies looking to refinance or take out new loans. The Mortgage and Finance Association Australia CEO, Anja Pannek, has...

Hold onto your hats, folks! The Japanese yen took a nosedive after the Bank of Japan (BOJ) left its ultra-loose policy settings unchanged, including its closely watched yield curve control (YCC) policy. But wait, there's more! The BOJ also removed its forward guidance, which had previously pledged to keep interest rates at current or lower levels. So, what's the scoop? Market expectations had been subdued going into the meeting, but some were still hoping for tweaks to the forward guidance to prepare for an eventual exit from the bank's massive stimulus


Your request is accepted.
We will call you at the time interval that you chose
Next callback request for this phone number will be available in 00:30:00
If you have an urgent issue please contact us via
Live chat
Internal error. Please try again later