


EURUSD: Buscando liquidez en zonas de venta de la semana. Niveles clave de entradas y salidas
Escenario bajista: Ventas por debajo de 1.0820 / 1.0841... Escenario alcista: Compras sobre 1.0827...

¡No pierdas tu tiempo – mantente informado para ver cómo las NFP afectan al USD!
Aviso de Recopilación de Datos
Mantenemos un registro de tus datos para ejecutar este sitio web. Al hacer click en el botón, estás aceptando nuestra Política de Privacidad.

Manual para Principiantes de Forex
Tu guía definitiva a través del mundo del trading.

¡Revisa Tu Correo!
En nuestro correo electrónico, encontrarás el Manual de Forex 101. ¡Solo toca el botón para descargarlo!
Advertencia de Riesgo: Los ᏟᖴᎠs son instrumentos complejos y tienen un alto riesgo de pérdida de dinero rápidamente debido al apalancamiento.
El 70,72% de las cuentas de los inversores minoristas pierden dinero al operar ᏟᖴᎠs con este proveedor.
Deberías tener en consideración si comprendes el funcionamiento de los ᏟᖴᎠs y si puedes darte el lujo de arriesgarte a perder tu dinero.
¡Atención! ¡Su navegador no está actualizado!
Presione uno de los iconos de abajo para pasar a la página oficial del desarrollador y descargar la última versión del navegador.

Broker De Forex Online
Esta información no son consejos para inversión
As we move away from the bank crisis and de-dollarization concerns, a significant question on the minds of many traders is whether the US Dollar will experience a corrective rebound from its current position. This is a crucial question because it will set a precedent for predicting the price action of various commodities, particularly gold. To answer this question, let's examine the current price action on the charts and determine whether the US Dollar will strengthen in April after several weeks of bearish momentum.
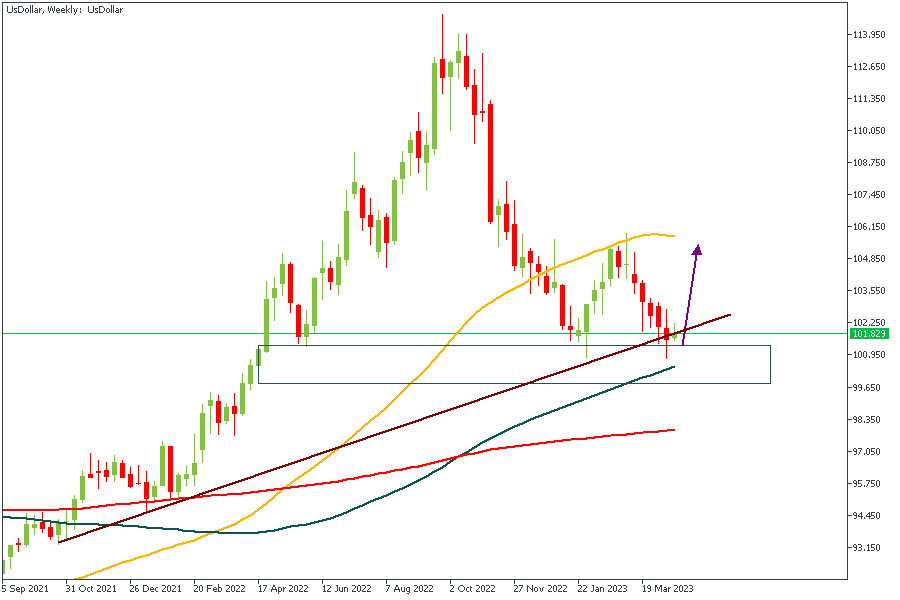
The US Dollar chart on the weekly timeframe shows the price currently around a key rally-base-rally demand zone with a confluence of trendline support, the 100-Period Moving Average, and a bullish array from the moving average positions. This confirms, to a large extent, the bullish sentiment and the expectation of a reversal from the Dollar in April.
Analysts’ Expectations:
Direction: Bullish
Target: 103.933
Invalidation: 99.629
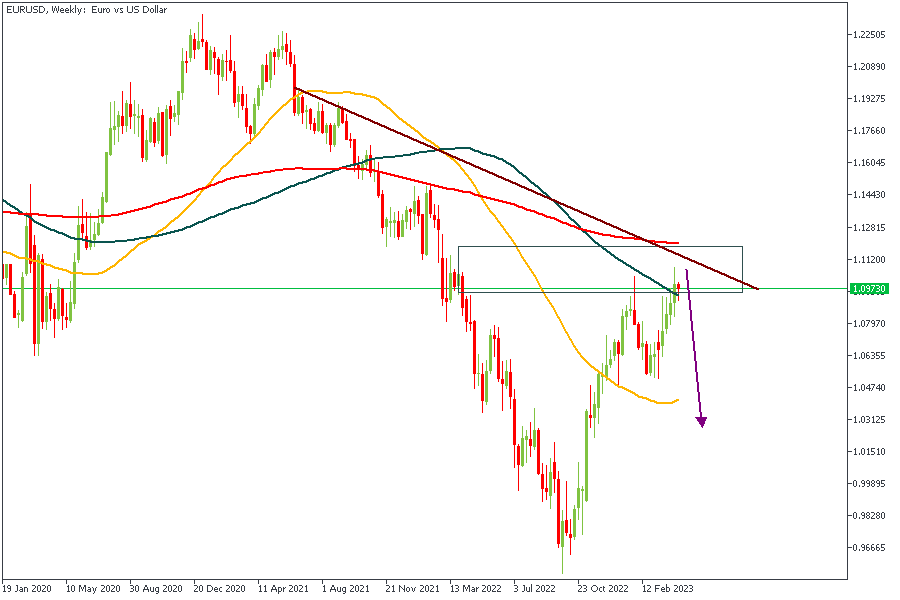
EURUSD has reached an important drop-base-drop supply zone on the weekly timeframe. A resistance trendline intersects this supply zone and the 100-Period Moving Average. Considering the manner of arrangement of the Moving Averages and the 88% of the Fibonacci retracement, we will likely see a big bearish movement away from the supply zone.
Analysts’ Expectations:
Direction: Bearish
Target: 1.07088
Invalidation: 1.11839
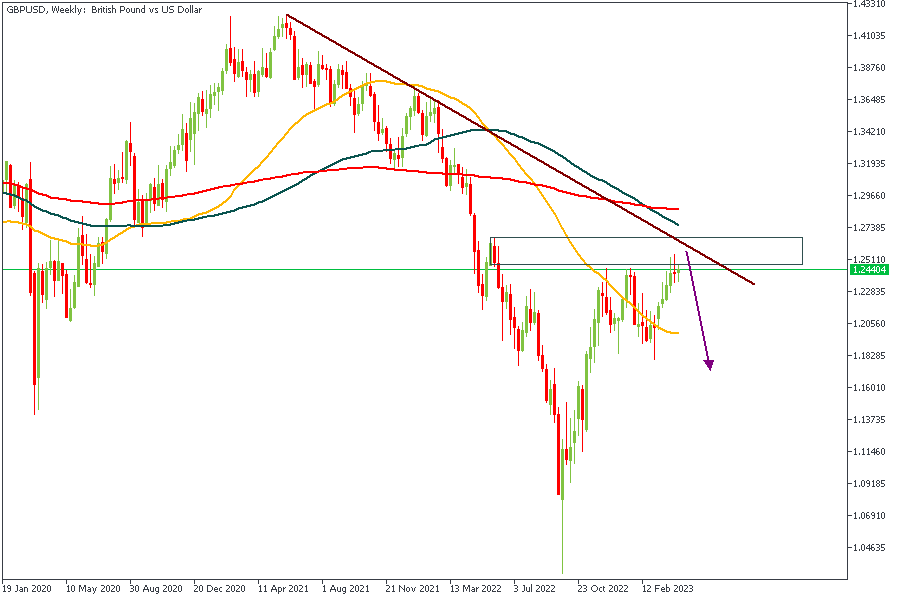
Similar to the EURUSD scenario, we find GBPUSD playing out within a rally-base-drop supply zone with the trendline intersection. The 100-Period Moving Average is also within close reach of the current price spot, which could contribute to the bearish movement as a resistance level.
Analysts’ Expectations:
Direction: Bearish
Target: 1.21033
Invalidation: 1.26882
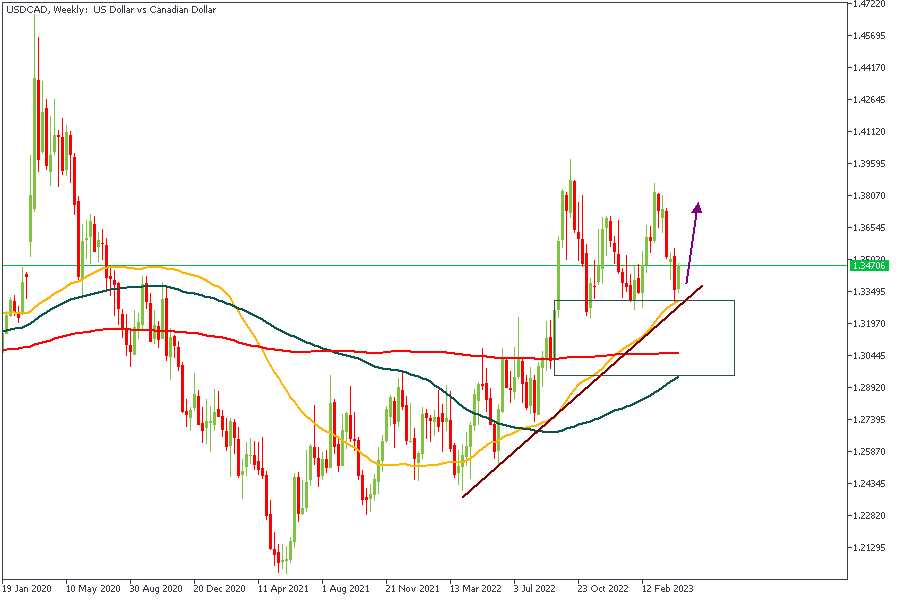
If the US Dollar truly plays out stronger, it would lead to a bullish price action here on the weekly timeframe of USDCAD. As a result, we need to check for factors that may contribute to the bullish outcome. First, the rally-base-rally demand zone and the 50-Period Moving Average serve as the initial confirmation. At the same time, the trendline support and the 76% of the Fibonacci retracement tool can be considered secondary confirmation factors. Overall, the bullish sentiment seems valid beyond any doubt.
Analysts’ Expectations:
Direction: Bullish
Target: 1.38227
Invalidation: 1.29965
The trading of CFDs comes at a risk. Thus, to succeed, you have to manage risks properly. To avoid costly mistakes while you look to trade these opportunities, be sure to do your due diligence and manage your risk appropriately.
Legal disclaimer: The content of this material is a marketing communication, and not independent investment advice or research. The material is provided as general market information and/or market commentary. Nothing in this material is or should be considered to be legal, financial, investment or other advice on which reliance should be placed. No opinion included in the material constitutes a recommendation by Tradestone Ltd or the author that any particular investment security, transaction or investment strategy is suitable for any specific person. All information is indicative and subject to change without notice and may be out of date at any given time. Neither Tradestone Ltd nor the author of this material shall be responsible for any loss you may incur, either directly or indirectly, arising from any investment based on any information contained herein. You should always seek independent advice suitable to your needs.

Escenario bajista: Ventas por debajo de 1.0820 / 1.0841... Escenario alcista: Compras sobre 1.0827...

Escenario bajista: Ventas por debajo de 150.30 con TP1:150.00... Escenario alcista tras retroceso: Compras intradía sobre 149.40 con TP: 150.00, TP2:151.00

Panorama General de la semana pasada…
Escenario bajista: Ventas por debajo de 1.0820 / 1.0841... Escenario alcista: Compras sobre 1.0827...

Escenario bajista: Ventas por debajo de 2200 / 2194 con TP1: 2190, TP2: 2180 y TP3: 2172 con S…

Escenario bajista: Ventas por debajo de 5220 ... Escenario alcista: Compras sobre 5225 (Si el precio falla en romper por debajo de 5220 con decisión)


Su solicitud ha sido aceptada
Te llamaremos en el intervalo de tiempo que elijas
La próxima solicitud de devolución de llamada para este número de teléfono estará disponible en 00:30:00
Si tienes algún problema urgente, contáctanos a través del
Chat en vivo
Error interno. Por favor, inténtelo nuevamente más tarde