


How to identify market reversal
Information is not investment advice
A trend is a major state of the market, so every trader needs to understand trends well. No trend will last forever: there will always be a moment when the trend you are trading reverses and a new trend starts.
Technical analysis can tell a trader whether a trend is close to changing its direction or confirm that a reversal has indeed happened.
A trader needs to know about an upcoming reversal for two reasons. Firstly, if a trader is already holding a position on a trend, he/she will want to exit it before the reversal. Secondly, the reversal is a time when a new trend emerges. If you read the market correctly and spot it in time, you will get an opportunity to join the trade early and gain more.
The probability of a reversal largely depends on the strength of the current trend: if a trend is weak, the reversal is more likely. There are several ways to estimate how strong a trend is. We can recommend two tactics: visual analysis and technical indicators.
Visual analysis of a potential reversal
Look at the highs and the lows of a trend. If the corrections are short, and the consolidations develop in narrow ranges, the trend is strong. In a strong bullish trend, the price strictly respects the first support formed at the previous highs:
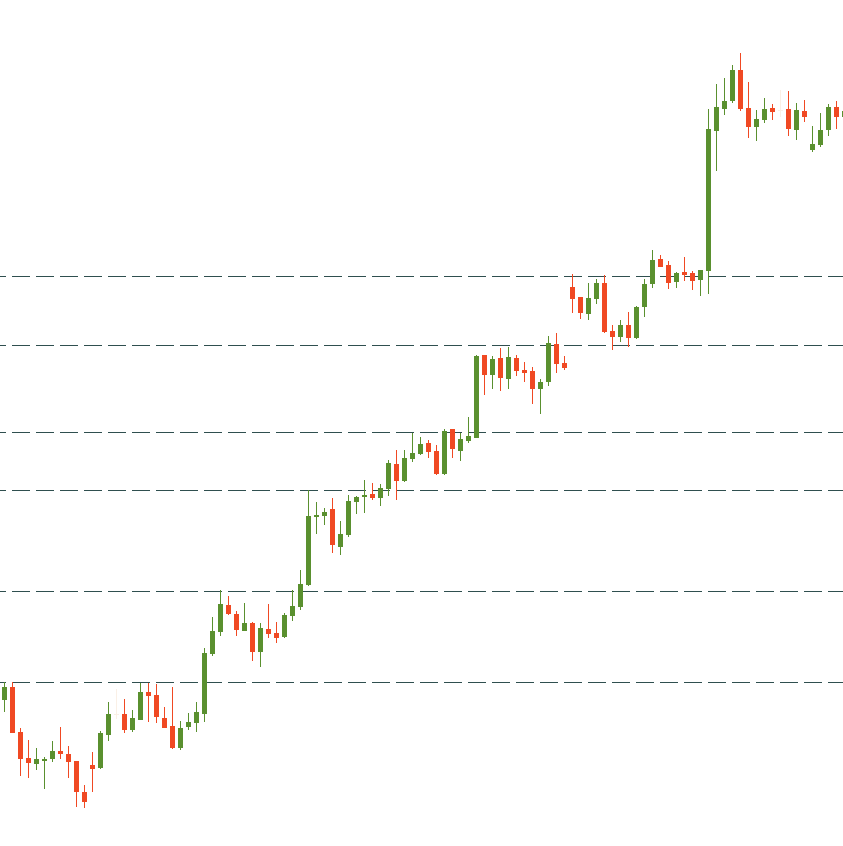
In case of a slow uptrend, the price can fall below the previous high (the initial support) but holds above the previous low.
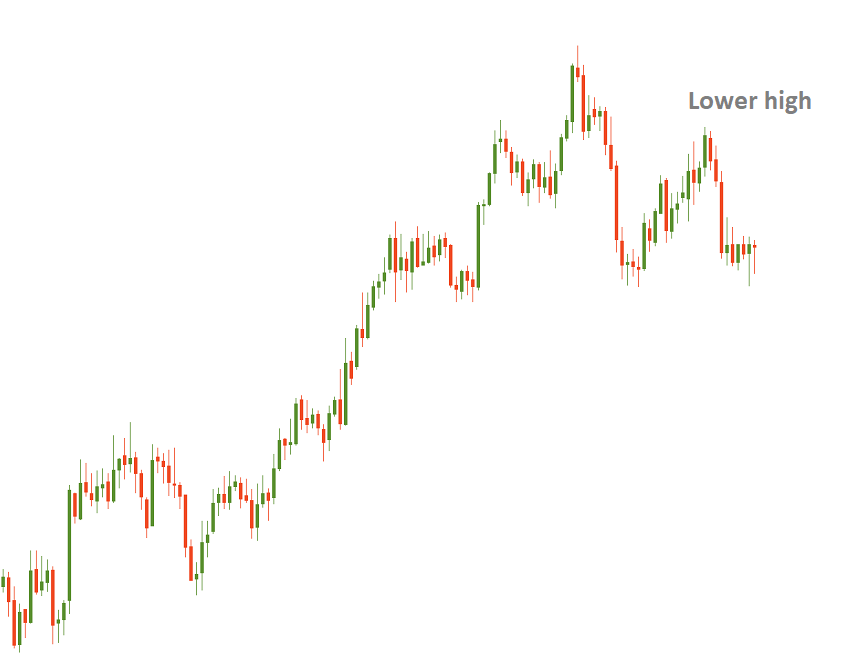
A weak uptrend can be recognized by the presence of a lower high. In this situation, traders will be afraid of the formation of the “Head and shoulders” pattern and the potential reversal of the market to the downside.
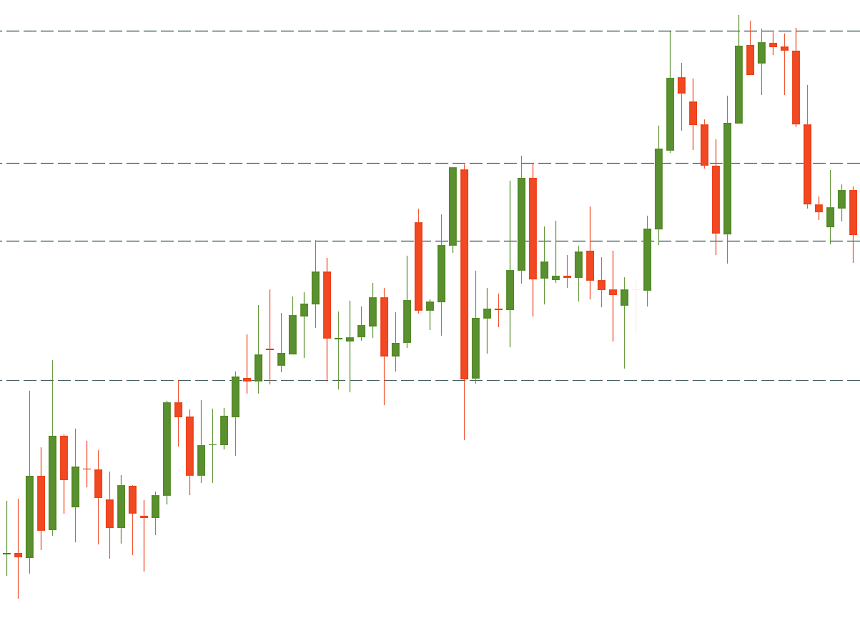
In addition, when the price starts revisiting a support line too often, it is a hint the uptrend is getting weaker.
As you can see from the explanations above, it’s necessary to distinguish between support #1 (previous high during an uptrend) and support #2 (previous low during an uptrend). A reversal happens when the price breaks support #2. Two situations are marked at the picture below. In the first case, the price has managed to stay above the second support. In the second case, it went below the second support and confirmed a reversal.
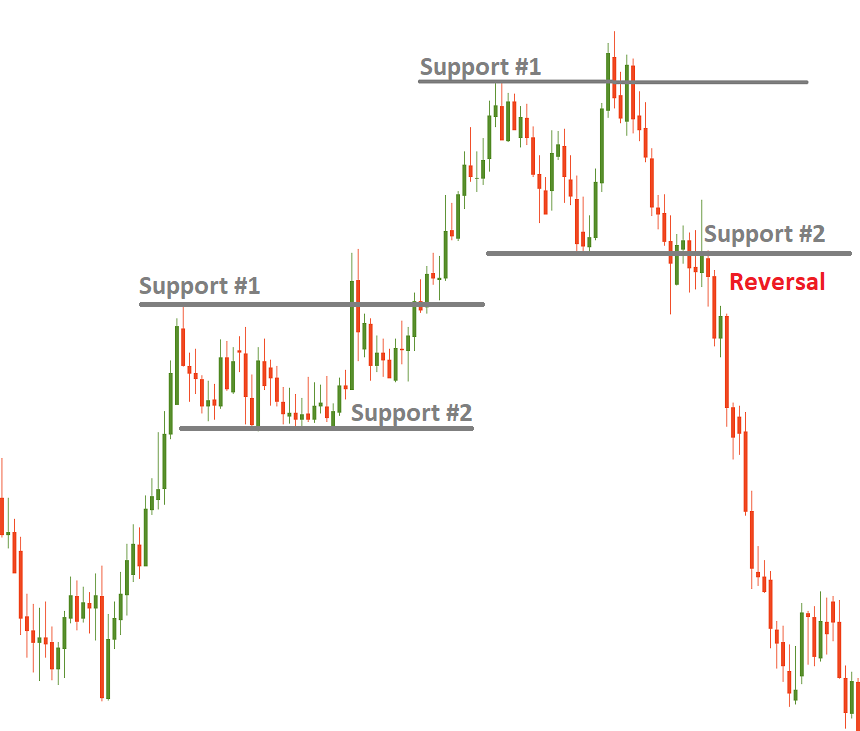
Notice that it’s very important to confirm that the price did indeed break below support/above resistance to declare a reversal. Take a close look at the Japanese candlesticks: the breakthrough candlestick should close below the support/above the resistance. An ideal situation is when the broken line is retested, but the price doesn't return above/below it. Breakthrough confirmation may also come from technical indicators and volumes.
Indicators that can help you identify a reversal
There is a number of technical indicators that may be quite helpful for identifying a reversal.
First of all, Moving Averages of various periods can either provide support/resistance levels beyond which traders will see a reversal or intersect sending the signals of a trend’s change. The Ichimoku indicator also has a set of lines which indicate when the market switches from the bullish to the bearish mode and vice versa.
Secondly, ADX is a leading indicator of a trend’s strength. The main line of the indicator rises when the trend is getting stronger. The ADX magnitude varies from 0 to 100. If the indicator is above 25, a trend is distinctive and strong. The moment when ADX rises above 25, it may be used as a confirmation of a breakout and trend reversal. The direction of the reversal may be shown by the two other lines of the indicator.
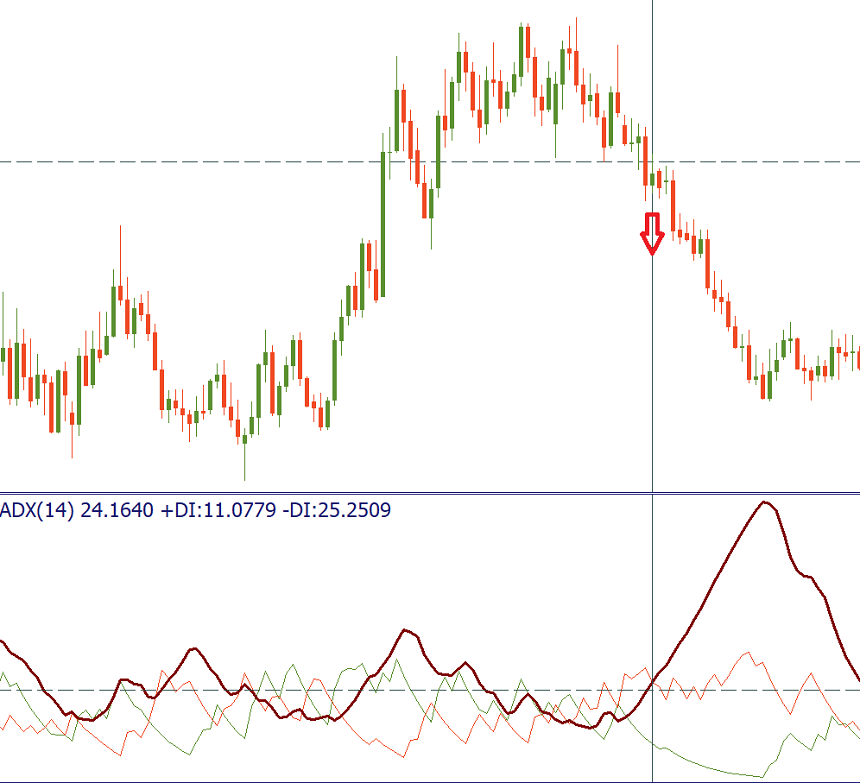
It’s also worth monitoring how ADX itself is trending. If the indicator forms a series of higher peaks, the trend is strong and a reversal is less likely.
You can also use volume indicators to estimate trend strength and confirm reversals. If a lower high was formed in an uptrend and the volume is lower as well, it’s a strong hint of a reversal to the downside.
Reversal or correction?
The main problem is that reversals often start as corrections. As a result, it’s often quite difficult to distinguish one from the other. In the table below we have assembled the information that will help you do that.
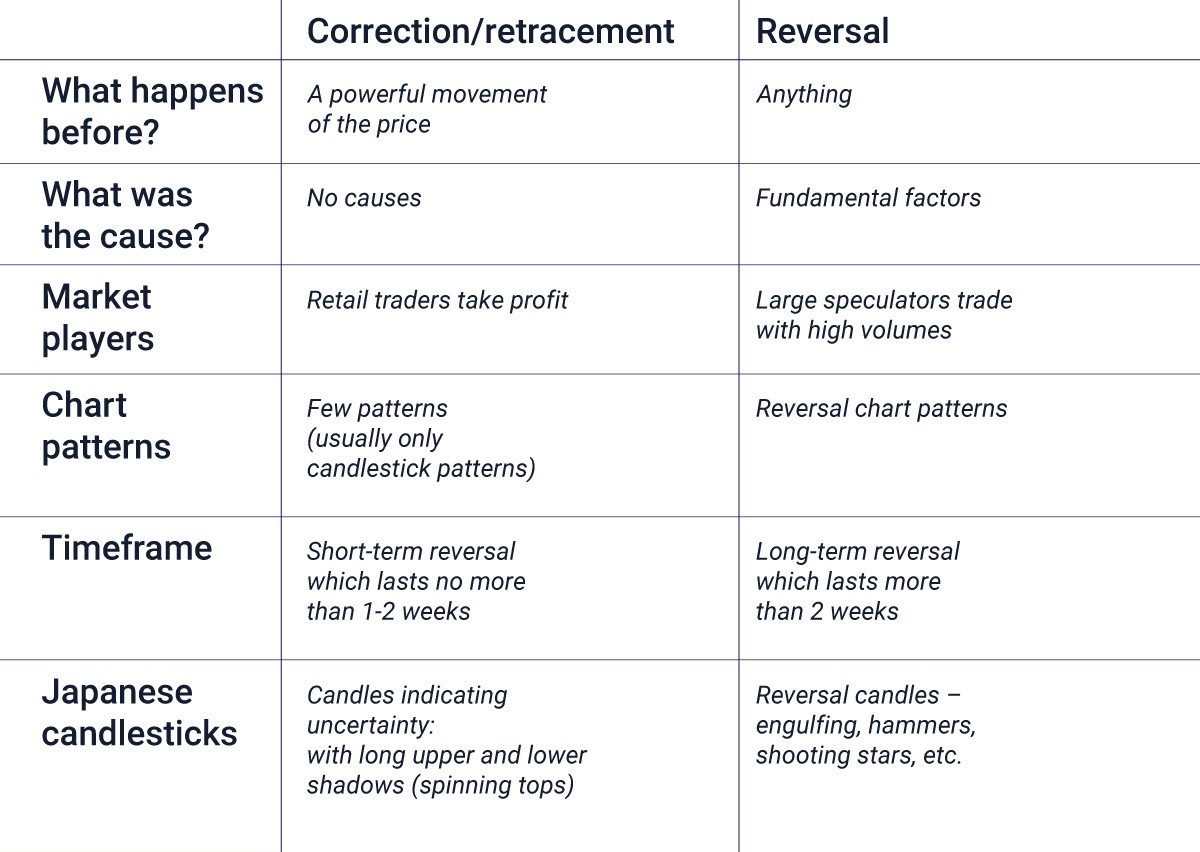
Notice that corrections are relatively short-term. Their nature is technical: corrections occur when the asset gets overbought or oversold as market players take profit after a move in line with the trend. It might be helpful to use Fibonacci tools to measure the depth of corrections. When price retracement is contained by 38.5% Fibo, the current trend is fairly strong and there are no signs of a reversal.
Reversals, on the other hand, represent a bigger change in the direction of the price action and are often caused by some fundamental reasons. The key feature of a reversal is that the price goes beyond the key support/resistance of a trend. If the market goes beyond the 50% Fibonacci retracement level, this might be a reversal.
Conclusion
All in all, to increase the precision of your forecasts, we recommend you using several methods of analysis to determine reversals correctly. Remember that the described methods do not guarantee a 100% chance of success, so it’s necessary to abide by the rules of risk management when you trade reversals.
Other articles in this section
- Fibonacci fan
- Fibonacci expansion
- Continuation candlestick patterns
- Gator Oscillator
- Awesome Oscillator
- Ranges
- Alligator indicator
- Bill Williams theory
- Fractals
- Chart patterns
- Uncovering Gann indicators
- Candlestick patterns
- Trend trading
- Carry trade
- Swing trading
- Position trading
- Day trading
- Scalping
- Trading styles
- Fibonacci tools
- Trader's psychology
- Japanese Candlesticks
- Trends
Choose your payment system


