


Williams’ Strategy
Bill Williams is the creator of some of the most popular market indicators: Awesome Oscillator, Fractals, Alligator, and Gator.

Don’t waste your time – keep track of how NFP affects the US dollar!
Data Collection Notice
We maintain a record of your data to run this website. By clicking the button, you agree to our Privacy Policy.

Join Us on Facebook
Stay on top of company updates, trading news, and so much more!
Thanks, I already follow your page!
Beginner Forex Book
Your ultimate guide through the world of trading.

Check Your Inbox!
In our email, you will find the Forex 101 book. Just tap the button to get it!
Risk warning: ᏟᖴᎠs are complex instruments and come with a high risk of losing money rapidly due to leverage.
72.12% of retail investor accounts lose money when trading ᏟᖴᎠs with this provider.
You should consider whether you understand how ᏟᖴᎠs work and whether you can afford to take the high risk of losing your money.
Warning! Old version of the browser!
Press one of the icons below to proceed to the official website of the developer and download the latest version of your browser.

Online Forex broker
2022-09-22 • Updated
Information is not investment advice
Hello traders! Trading strategies are essential for any profitable trader as they give the needed consistency in making decisions. Today we tell you about one of the most important reversal and continuation chart patterns for the stock market – opening range breakouts. We will give you a history of trading strategy based on this pattern, a number of examples and several useful hints. Let’s go!
The opening range is the space between the high and the low of the price for a given period after the market opens. Usually, this period is less than an hour long, and the opening range breakout (ORB) strategy uses these levels as entry points. Generally, traders use 5-, 15-, and 30-minute timeframes to trade ORB.
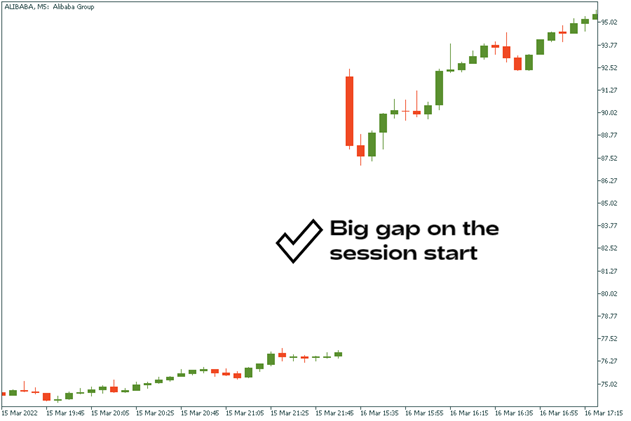
For example, if you are defining and trading the 15-minute opening range of Apple stock, then you are evaluating the high-low range of APPLE from the opening bell to 15 minutes following the opening bell. Within this opening range, the two most important levels that you would be watching would be the high and the low price within the first 15 minutes. Look at the figure to get the idea more clearly.
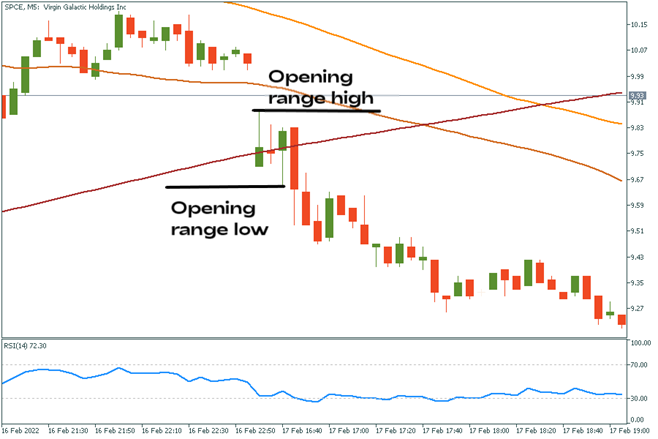
Here you can see that the trading session started with a gap in price. We are using a 15-minute opening range for SPCE stock, so we need to look at the M5 chart. After the price has created an opening range, we can look for entries on the breakout.
The ORB analysis tends to work the best on the markets that have a clearly defined opening and closing time, like stocks. The US stock market opens at 16:30 GMT+3, five days a week, so you can prepare for trading and have no worries of missing the trade.
The strategy was invented back in 1960-s by famous American trader and investor Arthur Merrill, who used it for almost 20 years in trading Dow Jones Industrial Average index. Although the strategy has some variations in it, the basis remains the same. To find an opening range some traders use a short-term moving average, most commonly a three-day average.
Another well-known trader, Sheldon Knight, used the percentage of the difference between an N-day high and N-day low to find a range. We assume that it’s better to keep things as simple as we can. Thus, using a short-term averages or highs and lows of a certain day is less effective than using price action at the start of the trading session.
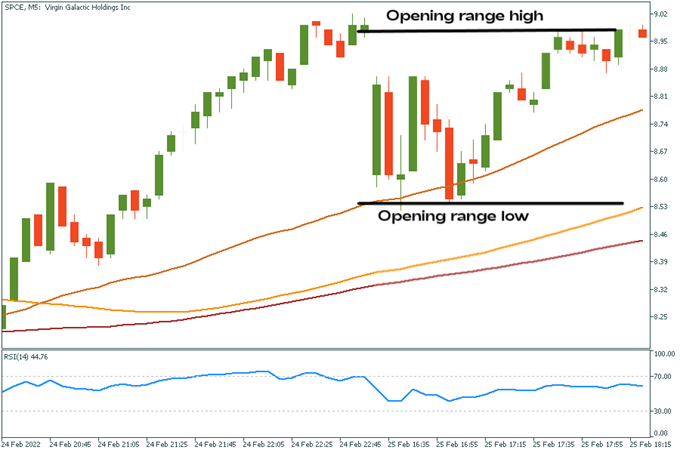
There are two ways of measuring the size of the ORB. Here is the first one: the first candle is the last one from the trading session of the previous day. The second candle is the first one created when the market opens. To get the range size you need to take the high/low of the previous closing and the high/low of the today’s opening candle. The distance between these two prices is the size of the opening range. Now see how we measure the size of a range:
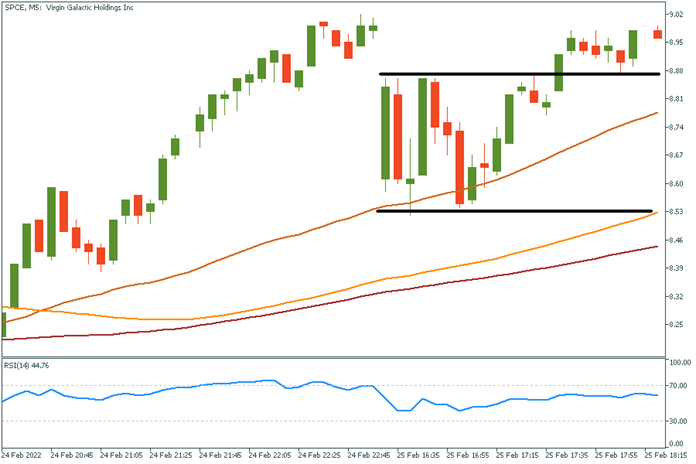
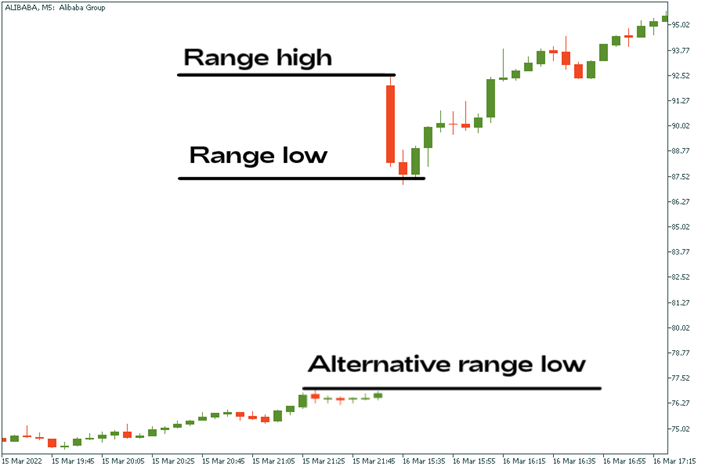
The other way of measuring the ORB is simply the high and low of a given period after the market opens. This period is generally the first 30 minutes or the first hour of trading.
During this period, you want to identify the high and low of the day. In addition, you will also want to account for the pre-market highs and lows, as these levels will often act like a magnet for price action after the bell rings. Let’s look at the same figure with a different measuring.
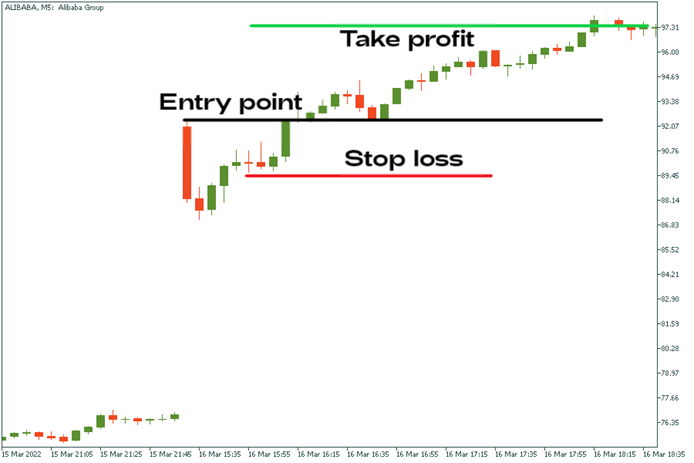
The most important part of the opening range trading is the breakout. You already know that. What you probably don’t know is that you can use an ORB calculator to help you find trading opportunities and use them in your favor. You can Google “Opening Range Breakout Calculator” to find an example of such site.
These sites calculate the high and the low of the opening range for you, so it should be easier to start trading. However, we strongly recommend you watch our Gap and Go video because in it you will find several tools to look for gaps in price. Thus, it will be much easier for you to set ORB levels.
The strategy consists of several steps:
Tips for better trading:
Bill Williams is the creator of some of the most popular market indicators: Awesome Oscillator, Fractals, Alligator, and Gator.

Trend strategies are good - they may give significantly good results in any time frame and with any assets. The main idea of the ADX Trend-Based strategy is to try to catch the beginning of the trend.

Counter-trend strategies are always the most dangerous but also the most profitable. We are pleased to present an excellent counter-trend strategy for working in any market and with any assets.


Your request is accepted.
We will call you at the time interval that you chose
Next callback request for this phone number will be available in 00:30:00
If you have an urgent issue please contact us via
Live chat
Internal error. Please try again later