


Williams’ Strategy
Bill Williams is the creator of some of the most popular market indicators: Awesome Oscillator, Fractals, Alligator, and Gator.

Don’t waste your time – keep track of how NFP affects the US dollar!
Data Collection Notice
We maintain a record of your data to run this website. By clicking the button, you agree to our Privacy Policy.

Join Us on Facebook
Stay on top of company updates, trading news, and so much more!
Thanks, I already follow your page!
Beginner Forex Book
Your ultimate guide through the world of trading.

Check Your Inbox!
In our email, you will find the Forex 101 book. Just tap the button to get it!
Risk warning: ᏟᖴᎠs are complex instruments and come with a high risk of losing money rapidly due to leverage.
72.12% of retail investor accounts lose money when trading ᏟᖴᎠs with this provider.
You should consider whether you understand how ᏟᖴᎠs work and whether you can afford to take the high risk of losing your money.
Warning! Old version of the browser!
Press one of the icons below to proceed to the official website of the developer and download the latest version of your browser.

Online Forex broker
2022-08-26 • Updated
Information is not investment advice
Making a step aside from everyday trading, let’s think a bit about how we see the charts, the prices, what may be true in them and what may be illusory. The dialogue below is presented to you to make the process of consideration more fun and easily perceivable while delivering to you the main ideas as explicitly as it is possible. Enjoy, and remember that this is just the first part of the talk, the second will be presented to you shortly.
Why am I here?
I’ll show you. You are a trader, right? Of course you, are, otherwise, why you would come here. Let’s say, you wanted to trade gold. By the way, it’s a good time to trade gold…
Is it?
Yes, it is, but I’m not your personal adviser. At least, not now. Anyway, you want to trade gold and feel like you want to be somewhat active during the day…
I am active during the day!
Perfect, then you go for H1.
Fair enough, so what did you want to show me?
The chart. What do you see?
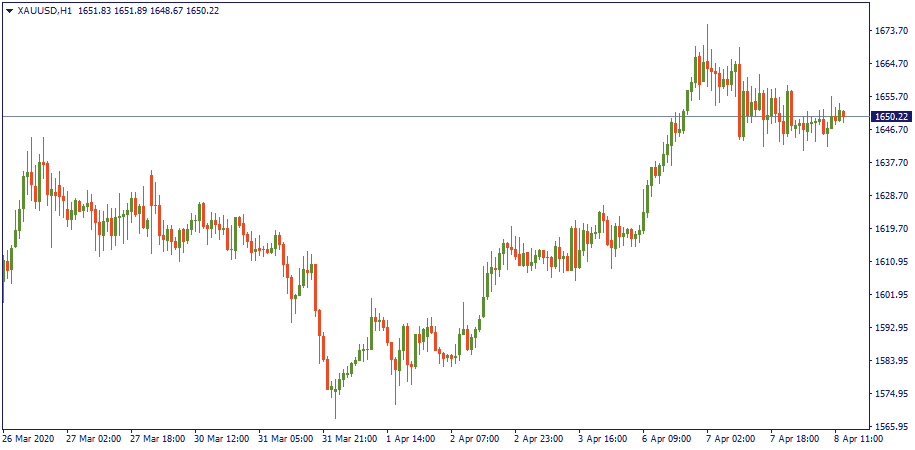
What do you mean? I see the gold price moving across the blank background. An empty raw chart. Just the price, nothing more.
Is something missing?
Well, yes, where are the support levels, resistance, indicators? I’m not a trading genius to see everything with my bare eyes! I need levels to base my decision upon, etc. Make it all visible.
No problem. Your trade, you do it. Put some levels over there.
What, you cannot do it?
I can, but the beauty is in the eyes of the seer. Maybe I will put a level in the wrong place, and later on, you will tell me I gave you a wrong signal, etc. So put it yourself. Unless you have a problem taking responsibility for it…
Of course, I have no problem! Anyway, it’s obvious in this example: anyone can see the consolidation at $1,650 right above the support of $1,642. Easy. That’s also confirmed by the fact that previously, the gold price bounced downwards from that level when it served as the resistance in the last week of March.
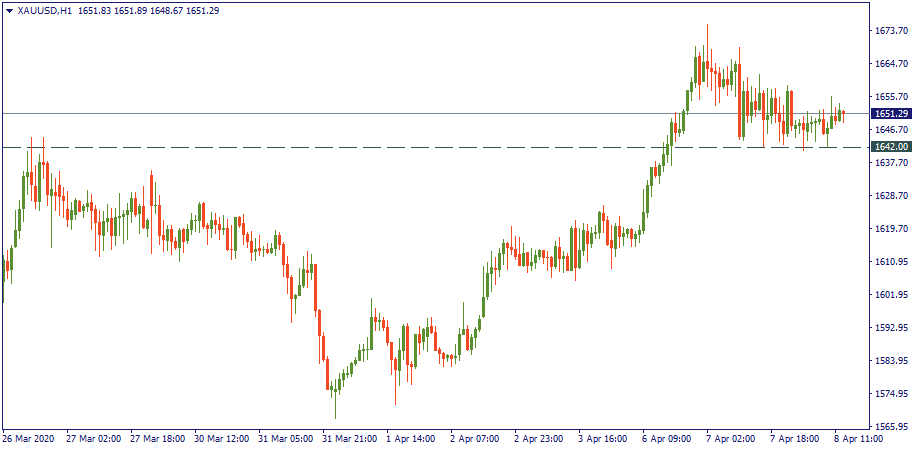
Perfect. See? It’s really easy. You have just put a level on the chart. But why is it not lower than $1,642? Say, at $1,640? Or the other way, why is it not higher, at $1,643?
Are you going to judge my precision? If that’s your question, then it doesn’t really make a big difference a dollar here or there. Yes, it does affect the floating profit, etc., but it does make sense to put the support somewhere in the ranges of $1,642.
Understood. But why specifically there? What do you observe there that makes you put the support at that level?
Are you an inquisitor? I observe the price coming down to the ranges of $1,642 and staying there for a while, and even going slightly above it - that means there is certain opposition to the further downward movement at that level.
Ok, I understand that the bullish opposition made itself visible when the price was coming to $1,642, but I don’t understand why you think that it is $1,642 that made the bulls reverse the market upwards. The way I see it: for certain reasons (some of them possibly known, all of them definitely unknown) there was a moment of time when the total demand for gold overpowered total offers to sell it, and at that moment, the price was approximately at $1,642. So I mean, it just happened that the internal market drivers became apparent at $1,642, but the price of $1,642 was not among those reasons.
I’m not getting you.
Ok, imagine you left home to work. You are now on the way to the metro or a bus station. Suddenly, when you reach a tree on your side, you remember that you forgot to switch off the oven. You immediately reverse and walk back home to switch the oven off. On the other side of the street, there was an old man who saw you doing that reversal and thought: “Suspicious, this guy reversed because of an oak tree”…
Do you enjoy talking puzzles?
Yes, but with this one, I just wanted to show you that in this scenario, the tree has nothing to do with the reason why you changed your movement. It just happened to be there when you remembered something and decided to stop there and reverse. The true reason was inside of you – the fact that you remembered and decided to change your direction. In the meantime, the outside circumstances were random. In this case, it was a tree. But you could have reversed any other moment, being in the metro, in the bus, anywhere else, and those external things would be just circumstances not affecting when, where and why you move.
True, then what?
Then here is how things work: there is an observer, there is a phenomenon, and there is a circumstance. In our scenario, the old man is the observer – the one who watches the situation; you reversing - is the phenomenon, an event being watched by the old man, and the tree is a circumstance – it happened to be around when you reversed.
Now, what do you make out of it?
I state that we, humans, tend to link phenomena to their circumstances i. e. make a causal relationship between the two. While in reality, there may be no relationship at all. In our case, the tree was just there, it didn’t force you to stop. It was just a decoration of the stage.
Enough of this philosophy. How do you apply it to the chart?
You, looking at the gold price, - are the observer. The price stopping at $1,642 - is the phenomenon. And $1,642…
…Is a decoration of the stage?
Exactly. The level of $1,642 was not the reason why the price stopped at it. It just happened that the price stopped at it the moment it stopped, it could have been any other level. Hence, there is no support at $1,642. There is no relationship between that level and the movement of the price. $1,642 does not affect in any way the impulses of bull or bears. Simply speaking, it was just a coincidence that on your chart bulls overpowered bears at a moment when the price was at $1,642. Therefore, this level per se does not support anything or anyone. As such, it does not exist.
Wait, but all the traders look at the same charts. They immediately see the results of their collective actions or at least they all see where the price moves while they make their trades and orders.
True, but let’s be real. Do you really think that millions of traders around the world sit and watch the screen, thinking: “Ok, now the price is coming to $1,642 – no way that’s gonna happen! I will not let the price drop lower! You… shall… not… pass!”
Ok, so you are saying that none of those support or resistance levels exist in reality and that traders just see something that appears fair to them and place their levels based on those appearances?
Let’s make a stop at this moment and consider what we have gone through so far, not drawing any premature conclusions though. The continuation of this dialogue will be shortly presented in the second part.

Bill Williams is the creator of some of the most popular market indicators: Awesome Oscillator, Fractals, Alligator, and Gator.

Trend strategies are good - they may give significantly good results in any time frame and with any assets. The main idea of the ADX Trend-Based strategy is to try to catch the beginning of the trend.

Counter-trend strategies are always the most dangerous but also the most profitable. We are pleased to present an excellent counter-trend strategy for working in any market and with any assets.


Your request is accepted.
We will call you at the time interval that you chose
Next callback request for this phone number will be available in 00:30:00
If you have an urgent issue please contact us via
Live chat
Internal error. Please try again later